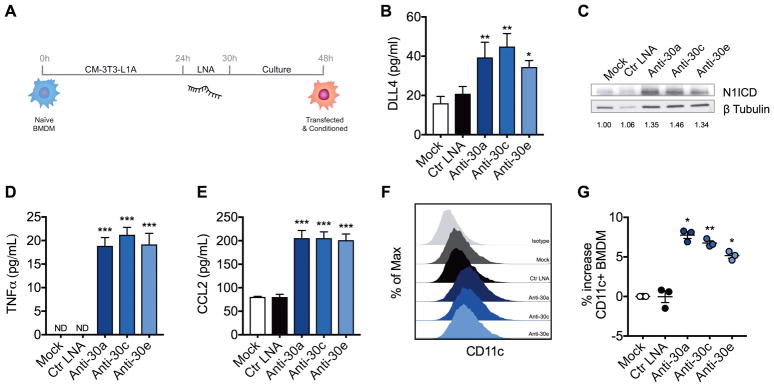
Fig. 3. miR-30 Inhibition Induces DLL4-Notch1 Signaling and M1 polarization.
BMDM were differentiated from the bone marrow of normal mice then used to study in vitro consequences of miR-30 inhibition on Notch signaling and macrophage polarization. (A) Schematic of in vitro experimental timeline. Differentiated BMDM were incubated in CM-3T3-L1A prior to transfection with microRNA inhibitor LNA and subsequent culture. Cells and supernatants were harvested at 48h. (B) DLL4 detected in culture supernatants by ELISA. (C) Western blot of cleaved/activated Notch1 (N1ICD). Fold induction relative to Mock is represented below each lane. (D–E) Pro-inflammatory cytokines TNFα (D), and CCL2 (E) detected in culture supernatants by ELISAs. (F) Flow cytometry histograms of CD11c expression in transfected BMDM. (G) Percentage increase in CD11c+ macrophages. For figures B–F, values are presented as mean ± SEM and are from a single experiment representative of 2–3 independent experiments. For figure E, data presented are mean ± SEM of 3 independent experiments. Statistical significance was determined by one-way ANOVA with Bonferroni post hoc correction. *p<0.05, **p<0.01, ***p<0.001 vs. Mock. See also Figures S3–S5.

