
Figure 1. Expression of phosphorylated TOPK in AKs and SCCs from human skin.
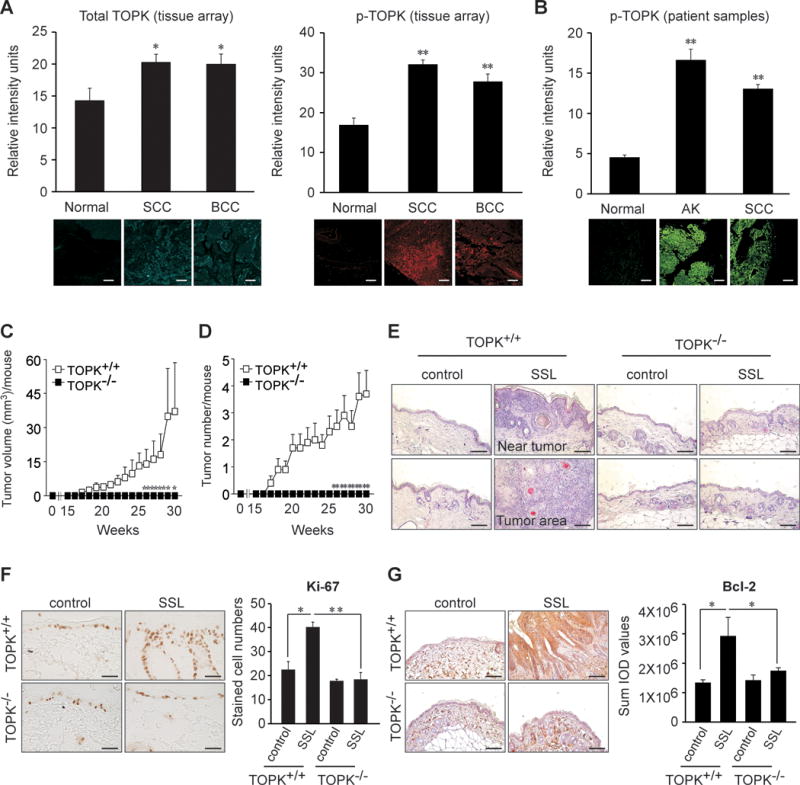
A human skin tissue array was analyzed by immunofluorescence staining to assess the expression of (A, left panel) total TOPK and (A, right panel) phosphorylated TOPK (Thr9) in SCCs (40 tissues) and BCCs (14 tissues) compared to normal skin (10 tissues). (B) The expression of phosphorylated TOPK (Thr9) was assessed in normal skin (30 samples from 6 human subjects), AKs (25 samples from 5 human subjects) and SCCs (40 samples from 8 human subjects). (C, D) Mice were divided into 4 groups that included SSL-untreated control groups or SSL-treated groups of SKH1 (Crl: SKH1-Hrhr) wildtype (TOPK+/+) or SKH1 TOPK knockout (TOPK−/−) mice (20 mice per each group). Average (C) tumor volume and (D) tumor number induced by chronic SSL in SKH1 TOPK+/+ or TOPK−/− mice. For Figure 1A–D, the asterisks (*, **) indicate a significant (p < 0.05 or p < 0.01, respectively) difference compared to the normal tissue group. (E) H&E staining of SKH1 TOPK+/+ or TOPK−/− mouse skin after chronic exposure to SSL. (F) Ki-67 proliferation marker levels in TOPK−/− mouse skin treated with chronic SSL. (G) Anti-apoptotic Bcl-2 protein levels in TOPK−/− mouse skin treated with chronic SSL. Bcl-2 levels are presented as the sum of integrated optical density (IOD) values. The asterisks (*, **) indicate a significant (p < 0.05 or p < 0.01, respectively) difference compared to SSL-treated TOPK+/+ mice. Scale bar = 100 μm.