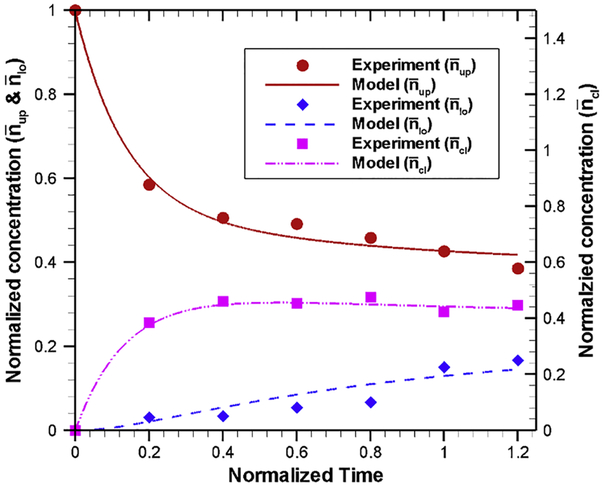
Fig. 10.
Comparison of (normalized) nanoparticle concentration predicted by mass-action model using the estimated kinetic rate parameters (Table 2) with experimental data for upper compartment, lower compartment and inside the cell at various normalized incubation time. Experimental results for different compartments are shown by different symbols (red circle: upper compartment, blue diamond: lower compartment and pink square: cell), while model results for different compartments are shown by different lines (red solid line: upper compartment, blue dashed line: lower compartment and pink line: cell).

