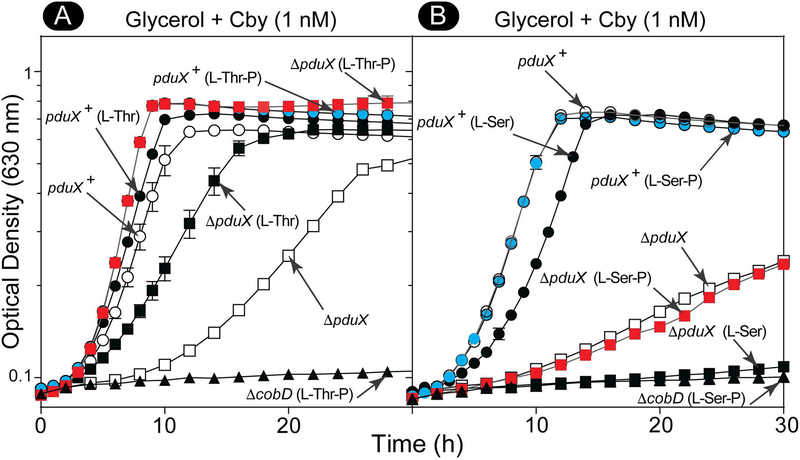
Figure 9. Growth analysis of S. enterica strains in the presence of L-Thr, L-Thr-P, L-Ser, and L-Ser-P.
Growth analysis of S. enterica cells grown normoxically at 37°C in NCE minimal medium with glycerol (22 mM), MgSO4 (1 mM), and A. Cby (5 nM) supplemented with L-Thr or L-Thr-P (1 mM), or B. Cby (1 nM) supplemented with L-Ser or L-Ser-P (1 mM). The amino acid or phospho-amino acid supplement is indicated in parentheses next to the strain genotype. Representative graphs of two independent experiments performed in triplicate. Error bars represent the standard error of the mean. Figure key: Panel A: ΔpduX (□), ΔpduX (L-Thr) (■), ΔpduX (L-Thr-P) (■), pduX+ (○), pduX+ (L-Thr) (●), pduX+ (L-Thr-P) (●), ΔcobD (L-Thr-P) (▲), Panel B: ΔpduX (□), ΔpduX (L-Ser) (■), ΔpduX (L-Ser-P) (■), pduX+ (○), pduX+ (L-Ser) (●), pduX+ (L-Ser-P) (●), ΔcobD (L-Ser-P) (▲).

