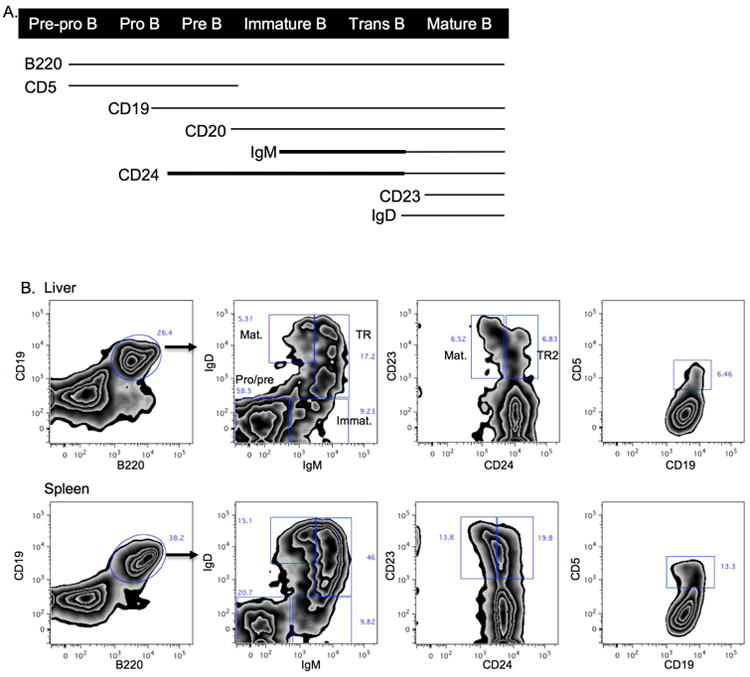
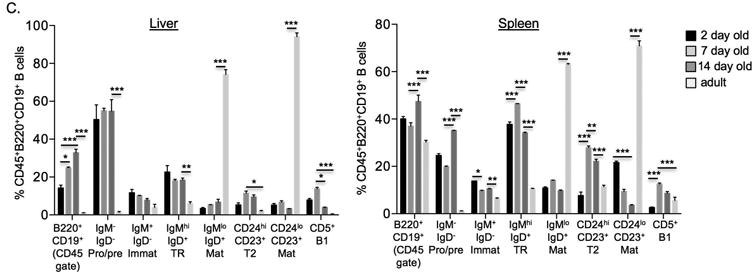
Figure 1.


B cell development in the normal neonatal liver and spleen. A. Diagram of B cell surface marker expression during B cell maturation. Thicker lines denote higher levels of expression. B. Representative contour plots of B cell subsets in 7 day old liver and spleen (gated on live cells, FSC/SSC lymphocytes, CD45+cells, B220/ CD19+ cells). C. Summary of B cell subset frequencies in the liver and spleen of 2 day, 7 day and 14 day old mice (gated on live, FSC/SSC, CD45+, B220/ CD19+ cells; note that first set of bar graphs is B220/CD19+ cells gated on live, FSC/SSC and CD45+ cells). Imm: immature, TR: transitional, TR2: transitional-2, Mat: mature. ***p < 0.0005; **p < 0.005; *p < 0.05
