Figure 1.

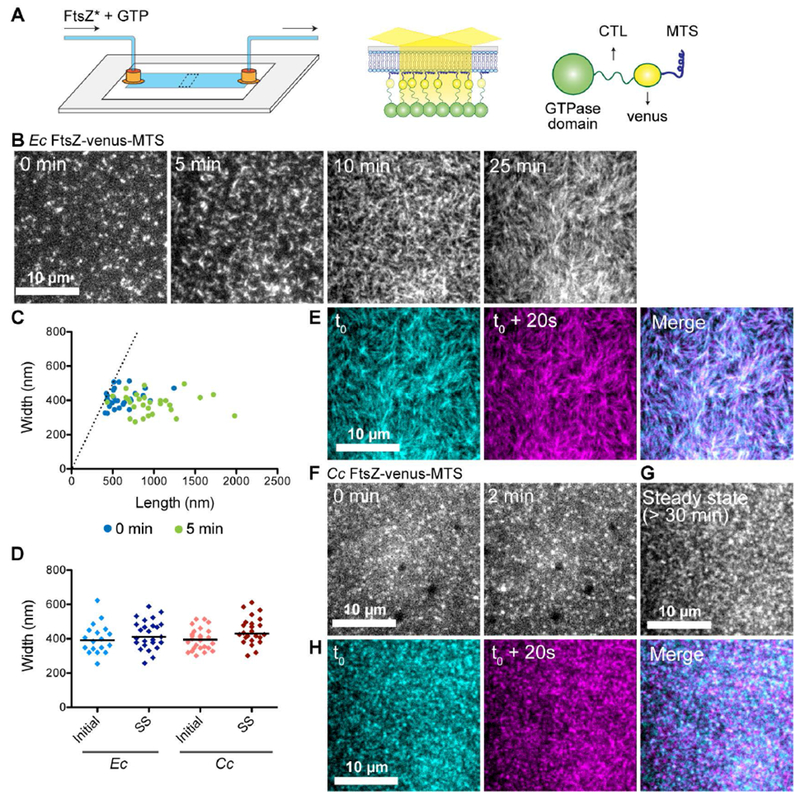
FtsZ protofilaments assemble as dynamic clusters on SLBs that form species-specific superstructures. A. Schematic describing the flow cell setup used for imaging FtsZ polymer assembly. FtsZ* (FtsZ-venus-MTS) incubated with GTP is flowed into the flow cell. FtsZ-venus-MTS protofilaments are recruited to the membrane through the MTS and are brought into the evanescent field of TIRF. B. Contrast enhanced TIRFM images showing structures formed by 2 μM Ec His6-FtsZ-venus-MTS preincubated with 2 mM GTP for 30 minutes and introduced into flow cell (at 5 μL minute−1) with the SLB composed of 33% DOPG and 67% DOPC lipids. Time on the images indicates approximate time passed after the initiation of flow. C. Plot showing width (distance along short axis) and length (distance along long axis) of clusters formed at 0 minutes (blue) and 5 minutes (green) for experiment shown in B. Dotted line indicates the identity line (width = length). D. Widths of clusters or bundles formed by E. coli His6-FtsZ-venus-MTS or C. crescentus FtsZ-venus-MTS at initial time point (time = 0 minutes) and at steady state (time ≥ 30 minutes). Line indicates median. E. Individual frames and merged images showing overlay of structures formed by Ec His6-FtsZ-venus-MTS at steady state spaced 20 seconds apart (cyan – time ‘t0’, magenta – time ‘t0 + 20 seconds’, white regions in the merged image represent colocalization of signal) F.& G. Contrast enhanced TIRFM images showing structures formed by 1.8 μM Cc FtsZ-venus-MTS preincubated with 2 mM GTP for 30 minutes and flowed into flow cell (at 5 μL minute−1) with the SLB composed of 33% DOPG and 67% DOPC lipids. Time on the images indicates approximate time passed after the initiation of flow. G. Steady state structures formed by Cc FtsZ-venus-MTS after flow was stopped. H. Individual frames and merged images showing overlay of structures formed by Cc FtsZ-venus-MTS at steady state spaced 20 seconds apart (cyan – time ‘t0’, magenta – time ‘t0 + 20 seconds’, white regions in the merged image represent colocalization of signal). Scale bar – 10 μm. Reaction buffer contains 50 mM HEPES pH 7.3, 5 mM Mg(CH3COO)2, 300 mM KCH3COO, 50 mM KCl, 10% glucose, 0.1 mg mL−1 casein (blocking agent).
