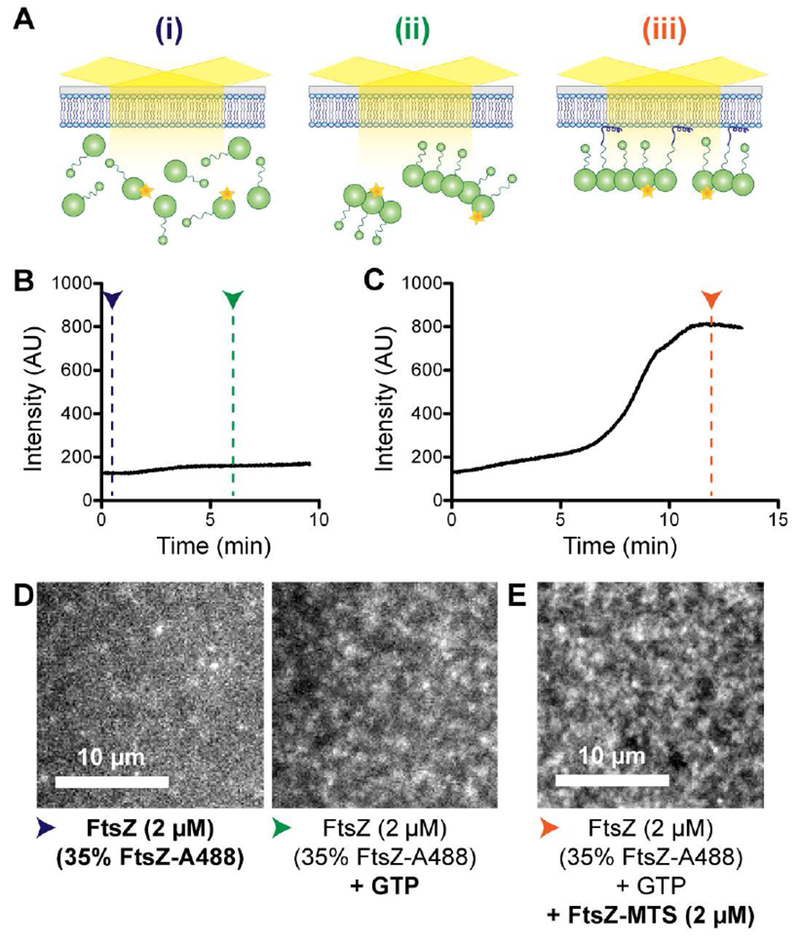
Figure 2.

FtsZ-MTS co-polymerizes with FtsZ and recruits protofilaments to SLBs. A. Schematic corresponding to the experimental setup in B – E. (i). Flow cell containing 20% DOPG and 80% DOPC SLB equilibrated with 2 μM FtsZ (35% FtsZ-Alexa488), (ii) At steady state after flowing in 2 μM FtsZ (35% FtsZ-Alexa488) with GTP, and (iii) At steady state after subsequently flowing in 2 μM FtsZ (35% FtsZ-Alexa488) and 2 μM FtsZ-MTS (unlabeled) with GTP. B. & C. Fluorescence intensity on the SLB averaged over the frame (~ 400 μm2) over time. B. 2 μM FtsZ (35% FtsZ-Alexa488) with GTP was flowed at 0.5 μL minute−1 into a flow cell equilibrated with 2 μM FtsZ (35% FtsZ-Alexa488). C. 2 μM FtsZ (35% FtsZ-Alexa488) and 2μM FtsZ-MTS with GTP was flowed at 0.5 μL minute−1 into a flow cell equilibrated with 2 μM FtsZ (35% FtsZ-Alexa488) with GTP. D. Contrast enhanced TIRFM images showing structures corresponding to experiment in B, immediately after beginning flow (blue arrowhead) and at steady state (green arrowhead). E. Contrast enhanced TIRFM image showing structures corresponding to experiment in C at steady state (orange arrowhead). Blue, green and orange arrowheads correspond to stages (i), (ii), and (iii) respectively as depicted in A. Scale bar – 10 μm. Reaction buffer contains 50 mM HEPES pH 8.0, 0.1 mM EDTA, 2.5 mM MgCl2, 300 mM KCl, 1% glycerol, 0.1 mg mL−1 casein (blocking agent), 0.5 mg mL−1 ascorbate.
