
Figure 1.
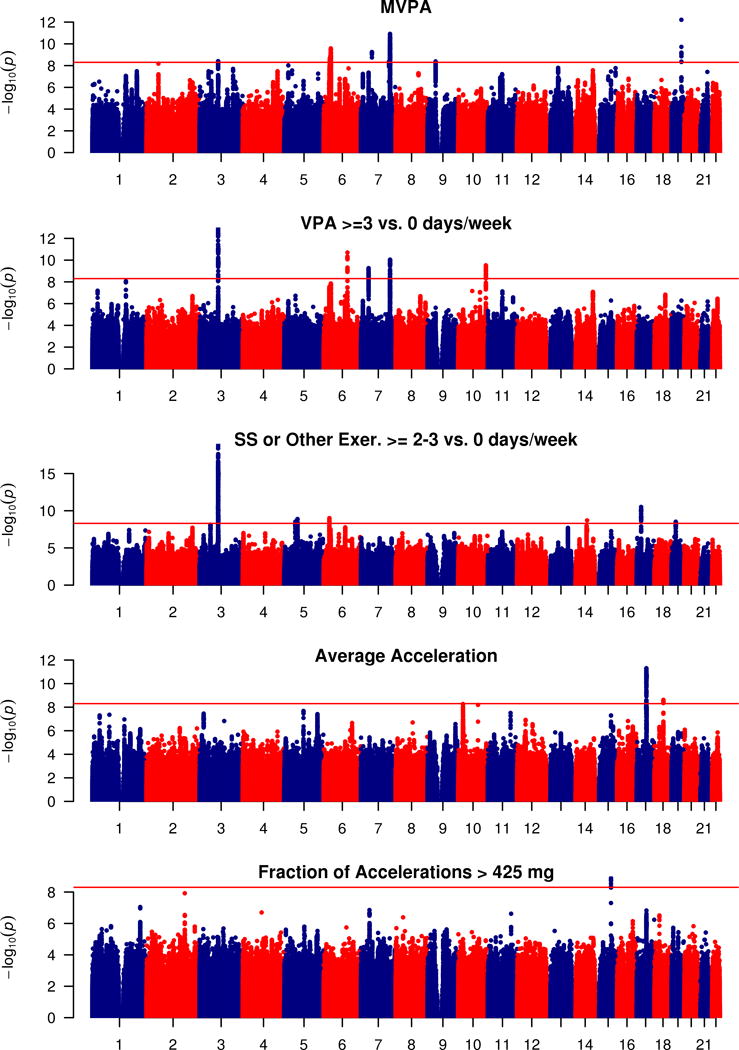
Manhattan plot of GWAS for self-reported MVPA and VPA, strenuous sports or other exercises (abbreviated as SS or Other Exer.), and for accelerometer-based average accelerations and fraction of accelerations > 425 mg. Negative log10-transformed p-value for each SNP is plotted by chromosome and position (x-axis). The red horizontal line represents the threshold for genome-wide significant associations (p<5 × 10⁻⁹).