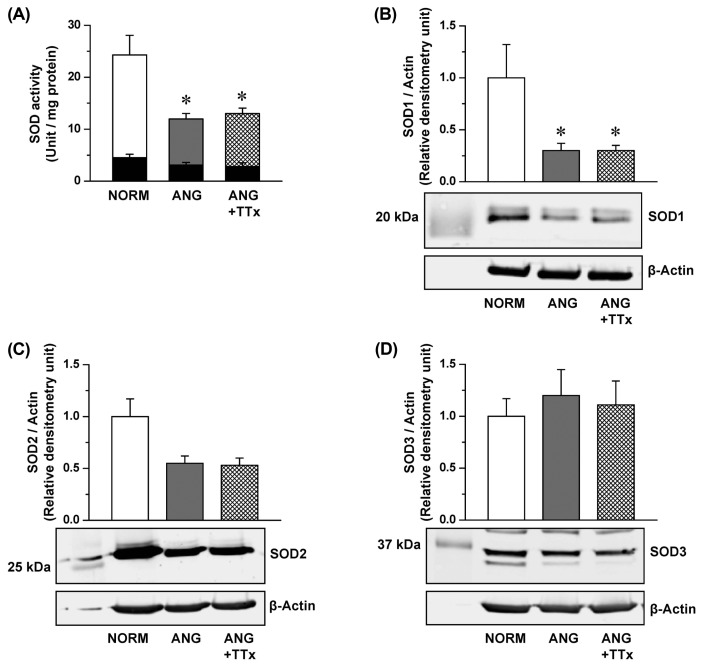
Fig. 2.
Superoxide dismutase (SOD) activity (A; n = 5–6) and protein expression of SOD1 (B; n = 4–5), SOD2 (C; n = 5–7), and SOD3 (D; n = 4–5) in the small mesenteric arteries of NORM, ANG, and ANG + TTx. (A) SOD activity was normalized to mg protein, and black inserted bars are SOD activity with potassium cyanide treatment. (B, C, D) Relative densitometric units of the enzymes were normalized to that of β-actin. *p ≤ 0.05 vs. NORM.

