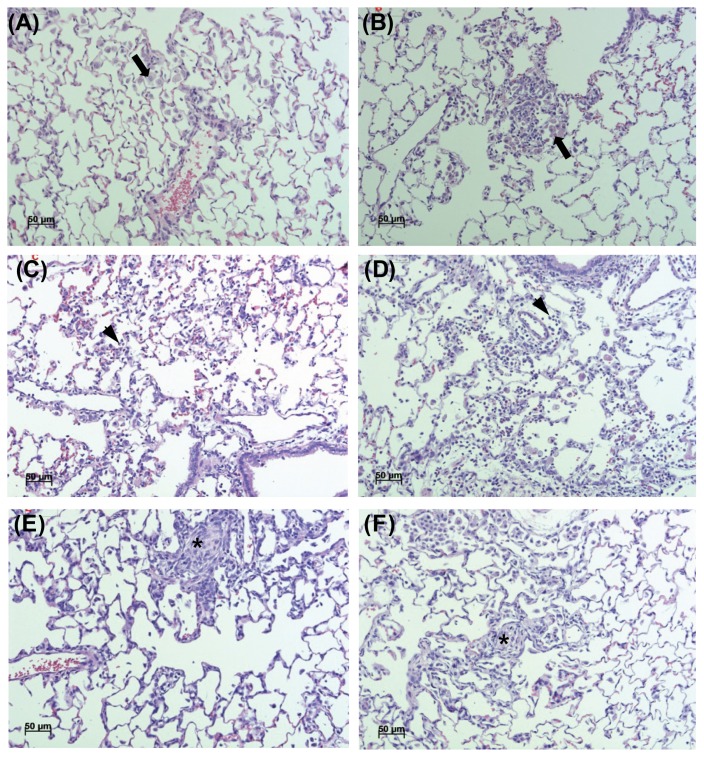
Fig. 3.
Representative photographs of lung sections from the 5mg/m3 in exposure group (A), 5mg/m3 in recovery group (B), 1mg/m3 in exposure group (C), 1mg/m3 in recovery group (D), 0.2mg/m3 in exposure group (E) and 0.2mg/m3 in recovery group (F) stained with hematoxylin and eosin (200 ×). Alveolar macrophage accumulation (A, B; arrow), Inflammatory cells infiltration (C, D; arrowhead) and Granulomatous infiltration (E, F; asterisk) were shown.

