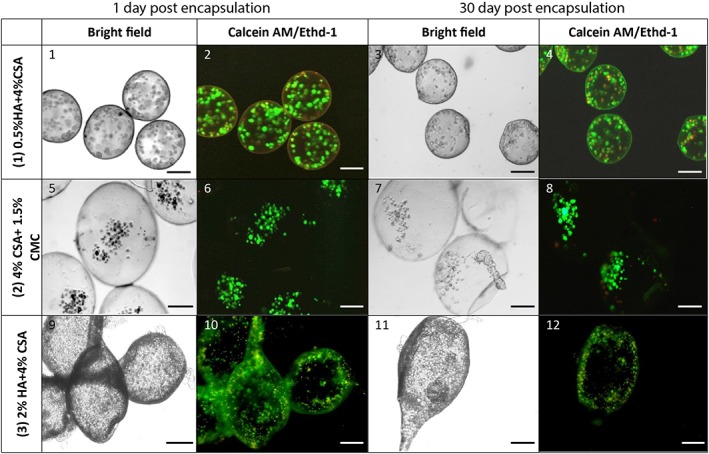
Figure 7.

Light microscopy of encapsulated MSCs. Color images show Calcein AM (green) and Ethidium homodimer (red) fluorescence as indicators of viable and nonviable cells, respectively. Capsules shown were generated at 12 kV using a 22‐G needle. Encapsulated MSC were maintained in static culture in 6‐well plates using low glucose DMEM supplemented with 10% FBS, 50 mg/mL gentamycin, and 2.5 mg/L amphotericin B. All scale bars are 200 μm
