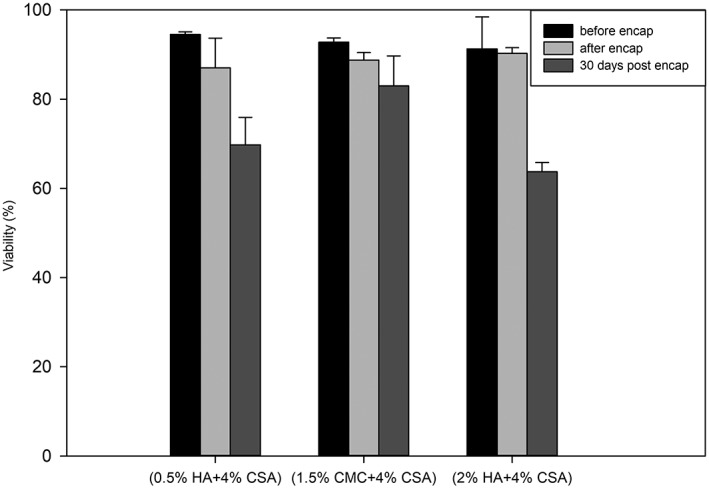
Figure 8.

Encapsulated cell viability in the three formulations immediately before and after encapsulation, as well as 30 days post‐encapsulation. Data are mean and standard deviation from three independent culture runs. Viability percentages were obtained by counting viable and nonviable cells after fluorescence imaging of capsules exposed to the viability probes Calcein‐AM and Ethidium homodimer. All results are capsules formed at 12 kV using the 22G needle
