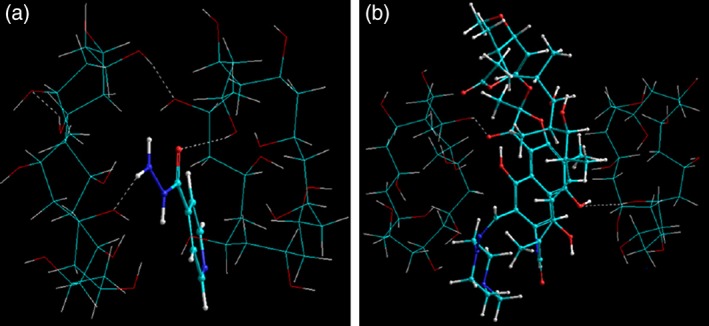
Figure 3.

Visualization of energy minimized geometrical preferences of two PVA molecules in conjugation with (a) an isoniazid molecule and (b) a rifampicin molecule showcasing the intramolecular and intermolecular interactions after molecular simulations in vacuum. Color codes for elements: C (cyan), O (red), N (blue), and H (white) (Reference 17; Reproduced with permission from IOP Science Publishers © 2012)
