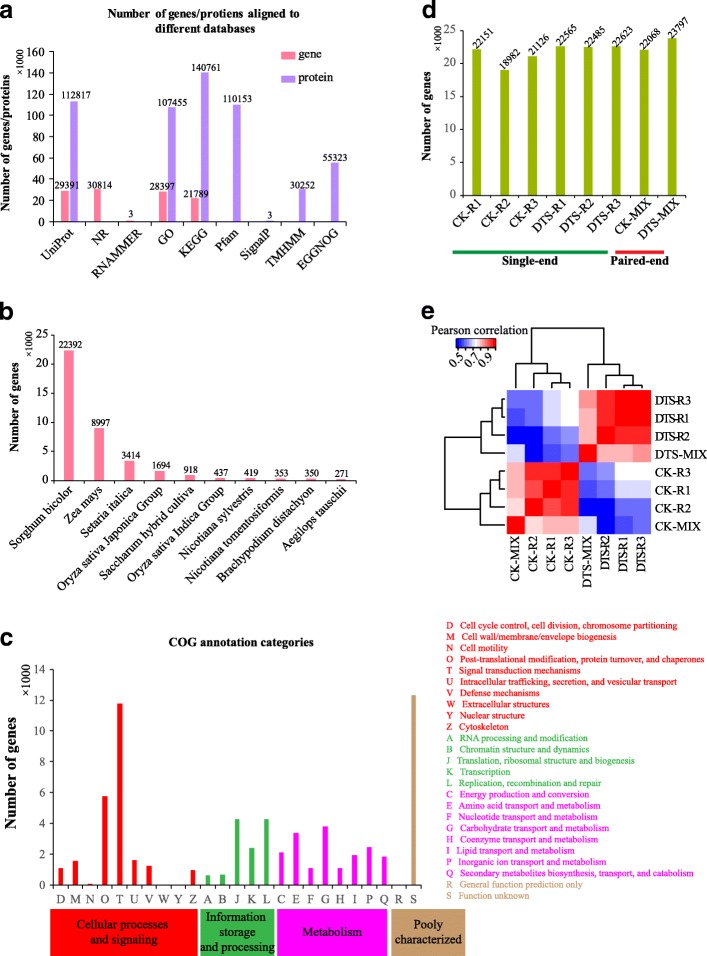
Fig. 2.
Annotation of the assembled sugarcane transcriptome and gene expression profiling. a Number of genes and predicted proteins aligned to different databases. b Distribution of species aligned by the assembled sugarcane genes. c COG annotation for the assembled sugarcane genes. d Number of genes identified in each sample (> 5 TPM). e Heat map of sample correlation based on the gene expression profile

