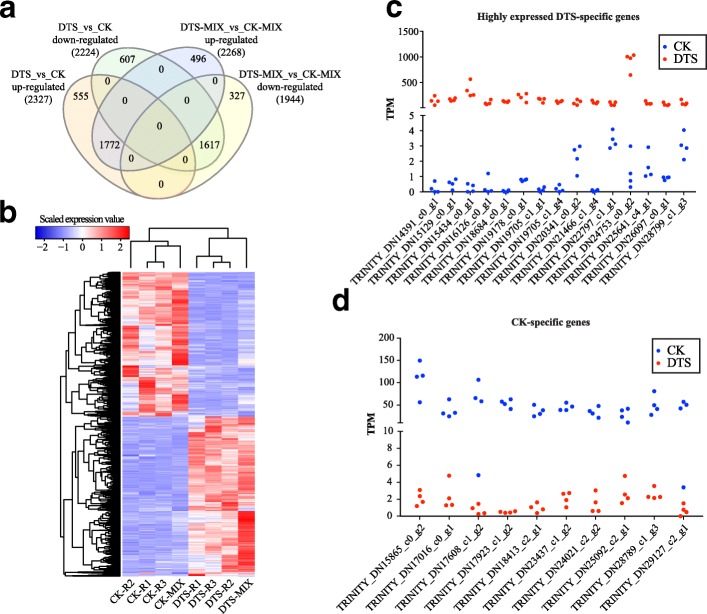
Fig. 3.
Differential expression analysis. a Venn diagram of DEGs identified by paired-end and single-end sequencing technologies. b Heat map of the DEG expression levels. c Highly expressed genes (> 100 TPM) exclusively identified in DTS samples. d Top 10 highly expressed genes identified exclusively in CK samples

