Fig. 6.

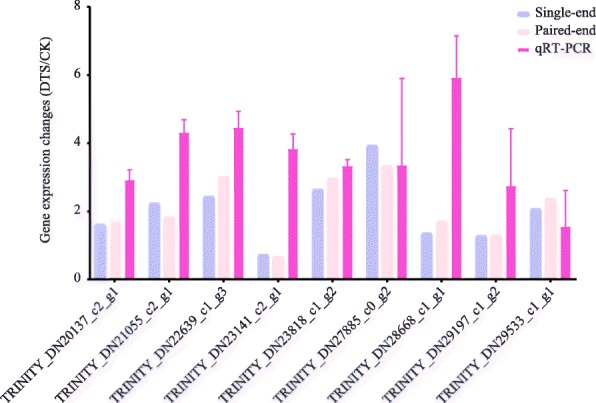
qRT-PCR validation. Gene changes represent the Log2 fold changes of DEGs identified by deep sequencing and the relative normalized expression (2-ΔΔCt) identified by qRT-PCR. Error bar represents the standard deviation

qRT-PCR validation. Gene changes represent the Log2 fold changes of DEGs identified by deep sequencing and the relative normalized expression (2-ΔΔCt) identified by qRT-PCR. Error bar represents the standard deviation