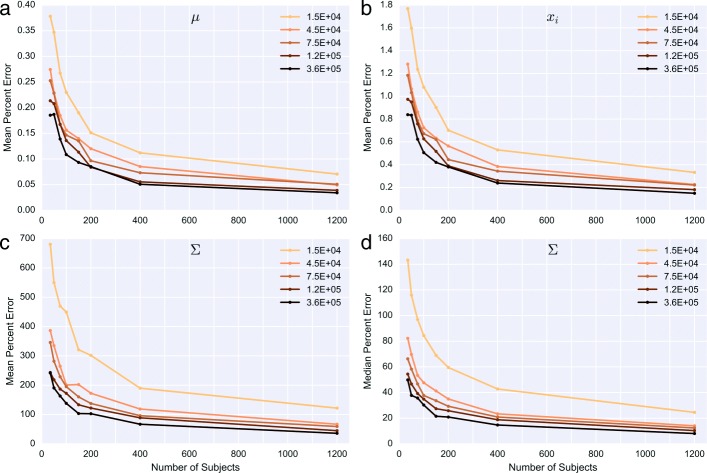
Fig. 2.
Error in multivariate normal hyperparameter estimation Original parameter (mean and covariance) values were derived from representative estimates for 79 targets across DMD (and an additional baseline target) using a cohort of high coverage samples. Each point represents the mean absolute percent error across 5 simulated sets of subjects at the coverage and cohort size indicated. For example, this is calculated as follows for μ and values of estimated : a shows percent error averaged across μ; b shows percent error averaged across the expected normalized xi values; c mean and d median percent error across terms in Σ. Legend values indicate total read pair counts (including baseline targets) for each coverage level simulated

