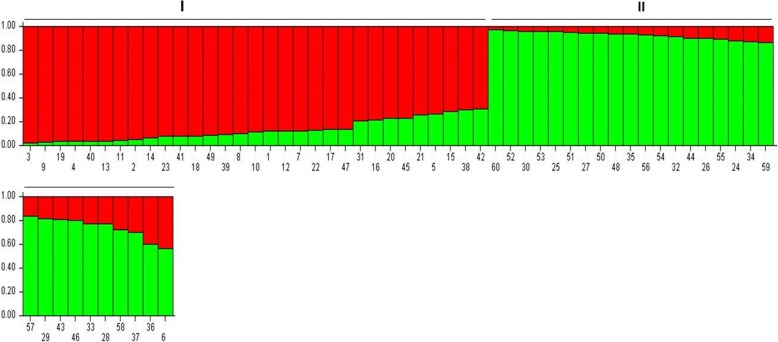
Fig. 7.
Assignment of the 60 analyzed wheat genotypes into two subpopulation (I and II) using STRUCTURE. Each coloured bar represent a wheat genotype. The Y axis represents the proportion of each wheat genotype genome assigned into two subpopulations. The numbers at the X axis are the serial number of wheat genotypes as listed in Additional file 1: Table S1. The bars with 80% or more (Y axis value ≥0.8) segment highlighted with green or red colour represent pure individual whereas those with both the colours are admixtures. Out of the 31 genotypes in sub-population 1, 17 are represented by tolerant and moderately salt tolerant indicating extensive similarity in their allelic combinations

