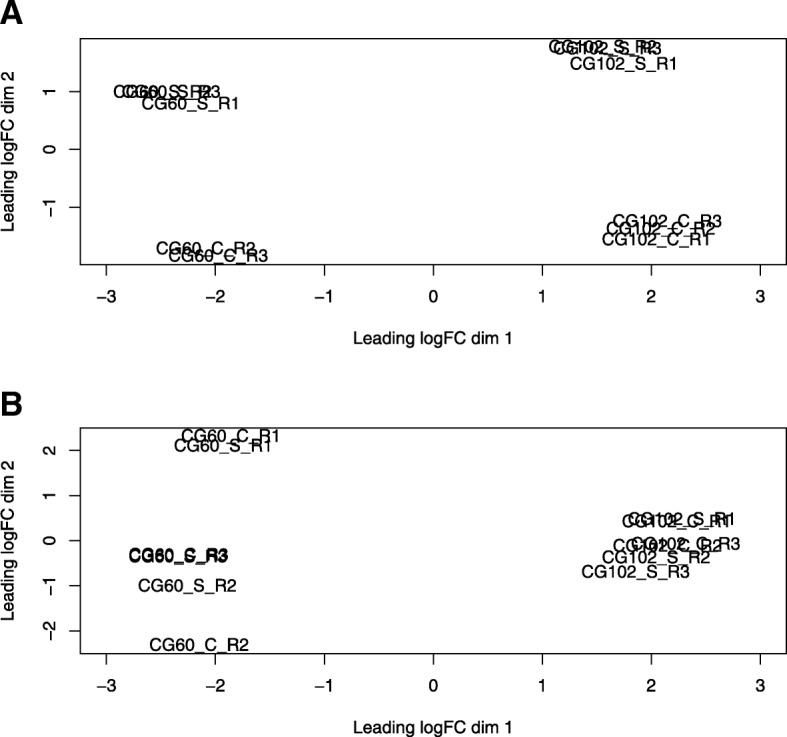
Fig. 3.

Multidimensional scaling (MDS) representations of distances between gene transcript abundance estimates. a Projections of samples from plants grown at low temperatures (14 °C/2 °C) for 24 h, and their controls grown continuously at 24 °C/14 °C. b Projections of samples from plants grown for 24 h at 24 °C/14 °C following a 72 h exposure to 14 °C/2 °C stress. Plants’ controls were grown continuously at 24 °C/14 °C. Samples are labelled as CG60/CG102_stressed/control plants_R1/R2/R3, where R is replicate
