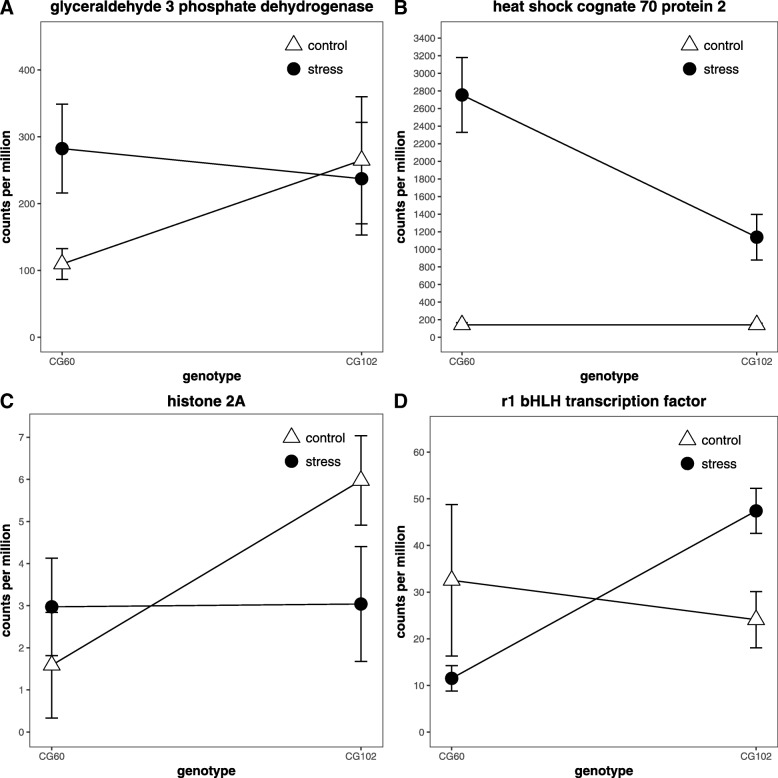
Fig. 6.
Examples of gene transcripts whose responses to cold differ between inbred lines. a and b plot the transcript abundances of two genes from control plants and plants grown 24 h in cold temperatures. c and d plot the transcript abundances of two genes from control plants and plants grown 24 h after the end of cold temperature exposure. A putative glyceraldehyde-3-phosphate dehydrogenase, GRMZM2G071630, (a) and a putative heat shock cognate 70 kDa protein 2, GRMZM2G428391, (b) increase in cold grown CG60 relative to control CG60 but do not increase in cold-grown CG102. These two genes are representative of the transcript changes amongst genes responsive to hydrogen peroxide (GO:00424542). (c) A histone H2A gene (GRMZM2G056231) is greatly downregulated in CG102 plants with past cold exposure relative to control plants, but it is not downregulated in CG60 plants with past cold exposure. This gene’s pattern is typical of genes involved in DNA replication and cell division. (d) The transcription factor R1 (GRMZM5G822829) is up-regulated in CG102 with past cold exposure but not up-regulated in CG60 with past cold exposure. A similar pattern was observed with other anthocyanin biosynthesis genes. Error bars represent the standard error

