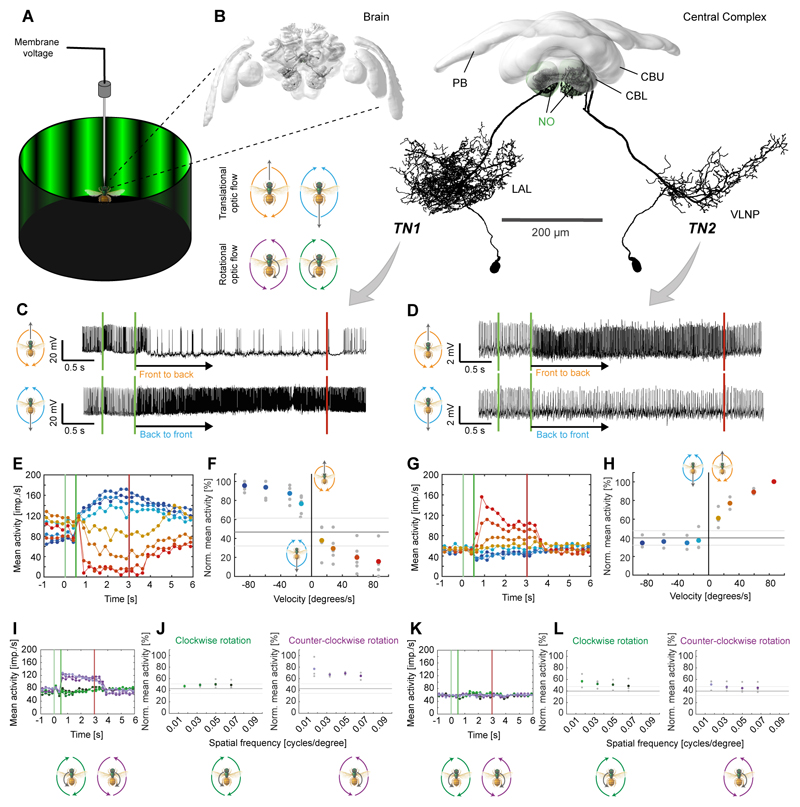
Figure 2. Neurons of the bee central complex are sensitive to translational optic flow.
(A) Schematic illustration of recording setup. The bee was placed inside a 360° LED arena that was used to display rotational (clockwise and counter-clockwise) and translational (forward and backward) optic flow. (B) 3D-reconstructions of TN1 (left) and TN2-neurons (right) registered into a common reference brain (additional morphologies in Fig. S2). Left: neurons embedded in whole brain; right: neurons with central complex only. Note that both cell types exist in both brain hemispheres. VLNP, ventrolateral neuropils; remaining abbreviations see Figure 1. (C,D) Voltage traces from intracellularly recorded cells responding to front-to-back (top) and back-to-front (bottom) translational optic flow. First green line: grating presented; second green line: motion onset; red line: motion stop. TN1-neuron (C), TN-2 neuron (D). (E,G) Activity of the same neurons to different stimulus velocities (–90°/s to 90°/s (blue to red); values: ±10, ±30, ±60, ±90°/s). Vertical lines as in (C,D). (F,H) Normalized mean activity during the final 2 s of each stimulus bout of TN1-neurons (F; n = 5) and TN2-neurons (H; n = 3). Colored circles: mean; grey circles: individual data-points; solid line: background activity (± SD, grey lines). (I/K) Responses to rotational optic flow at different spatial frequencies of the same neurons as (E/G). (J/L) Mean responses to rotational optic flow of the same neurons as (F/H). In (J) responses were tested only in four out of five cells from (F); shown only for cells located in the right brain hemisphere (n = 3), as preferences for clockwise and counter-clockwise rotations were inverted for left-side cells. See also Figure S1,S2,S3.

