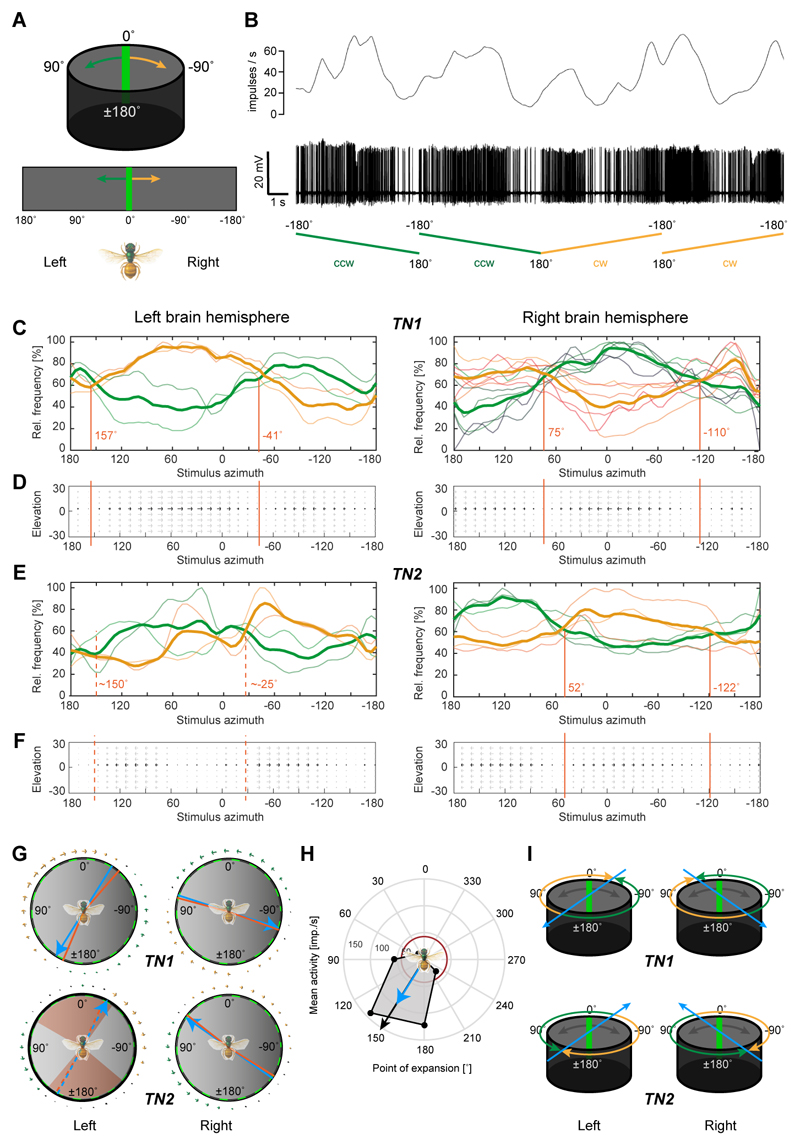
Figure 3. Receptive fields of optic-flow-sensitive neurons define encoded movement space.
(A) Top: stimulus for receptive-field mapping was a green bar moving around the bee at constant speed. Bottom: schematic display of flattened arena used for graphs in (C-F). (B) Typical neural response to a moving bar of a TN1-neuron. Top: gliding average of spike rate; bottom: spike train. Ramps indicate movement of bar, either clockwise (cw) or counter-clockwise (ccw). (C) Mean normalized activity (thick curve) during receptive field mapping of TN1-neurons shown with individual response curves. Yellow traces: cw movement; green traces: ccw movement. Responses of neurons in right (n=6) and left brain hemispheres (n=2) are approximately mirror-symmetric, but directionally inverted (e.g. green curve on the right mirrors yellow curve on the left). Different parts of the receptive fields are preferentially tuned to cw or ccw movement, with null-points with no observable tuning indicated by red lines. (D) Flow-fields indicating local directional tuning preferences of TN1 neurons, mapped onto spatial extent of the LED arena. Grey arrows indicate that the tuning could result from any position along the vertical axis of the arena (elevation range covered by the bar stimulus). (E,F) As in (C,D), but for TN2-neurons. Responses are inverted compared to TN1-neurons (left: n=2; right: n=3). (G) Calculated null-points (red) without directional tunings displayed in a circular diagram for both cell-types and both brain hemispheres. Blue lines: Average null-point assuming axial symmetry of responses (i.e. frontal null-point is opposite of posterior one), predicting an optimal point of optic-flow expansion. Arrows around the circle are based on flow fields in D/F. In TN2-cells of the left brain hemisphere a range of angles without clear tuning preference occurred and is indicated in red, with null-crossings of tuning preferences shown as dotted lines. (H) Responses to translational optic flow with different expansion-points (45° intervals) of one of the neurons in C (from left brain-hemisphere). Resulting preferred expansion point (black arrow) matches predictions from G (blue arrow). Red circle: background activity. I, Idealized preferred expansion points of TN-neurons from both brain hemispheres, which were used as a basis for modeling. See also Figure S2,S3.

