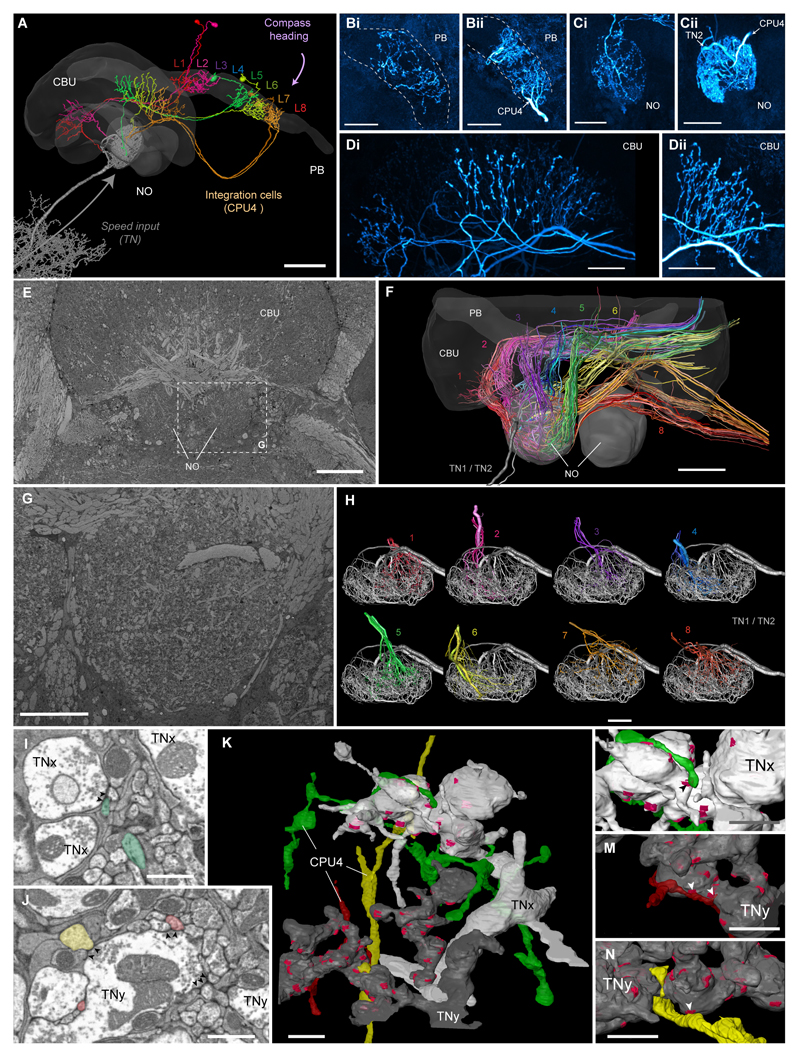
Figure 4. Speed neurons are presynaptic to proposed integrator cells.
(A) 3D-reconstruction of six CPU4-cells (colored) simultaneously stained with a single TN1-neurons (grey) from Megalopta genalis. Shown together with 3D surface reconstruction of central-complex (CX) neuropils (CBU, upper division of the central body; PB, protocerebral bridge; NO, noduli). The eight central-complex columns are numbered in the PB. (B-D) Maximal intensity projections of intracellularly filled CPU4-neuron arborizations in the PB (Bi, Bii), noduli (Ci,Cii), and the CBU (Di,Dii); two examples shown for each neuropil. Polarity of cells is clearly presynaptic in CBU, but inconclusive in PB and noduli, suggesting mixed terminals. (E) Single section from low-resolution (voxel size: 100x100x100 nm) block-face electron-microscopical image-stack of the bumblebee CX. (F) 3D tracing of all neurons innervating the right nodulus (based on image stack in E). Colors correspond to confocal data in A and indicate columnar identity. Fiber trajectories and arborizations in the CBU match the confocal data and allow identification of all 16-19 traceable cells per column as likely CPU4-cells. (G) Single section from medium-resolution (voxel size: 23x23x50 nm) data stack from the bumblebee. (H) CPU4-neurons from each CX-column possess overlapping projection fields within one nodulus, a prerequisite for possible microcircuits within the noduli. Shown are three to five cells from each bundle. (I,J) Single sections from high-resolution image stack (voxel-size: 11.5x11.5x50 nm) revealing synaptic vesicles associated with active zones (arrowheads) within TN-cells directly opposite of likely CPU4-cells (colored as in (H)). (K) Surface reconstruction of one terminal branch of each TN-neuron (grey; TNx and TNy, as identity cannot be established as TN1 or TN2 based solely on noduli fibers). Clearly identifiable active zones are highlighted in magenta. Three columnar neurons postsynaptic to TN-cells (colors according to bundle identity) are also reconstructed and were traced to their bundle of origin. (L-M) Detailed 3D-views of contact points of three CPU4- and TN-cells (arrowheads) shown in (I,J). Scale bars: A/E/F, 50 μm; B-D,G/H, 20 μm; K, 2 μm; I/J/L-N, 1 μm.

