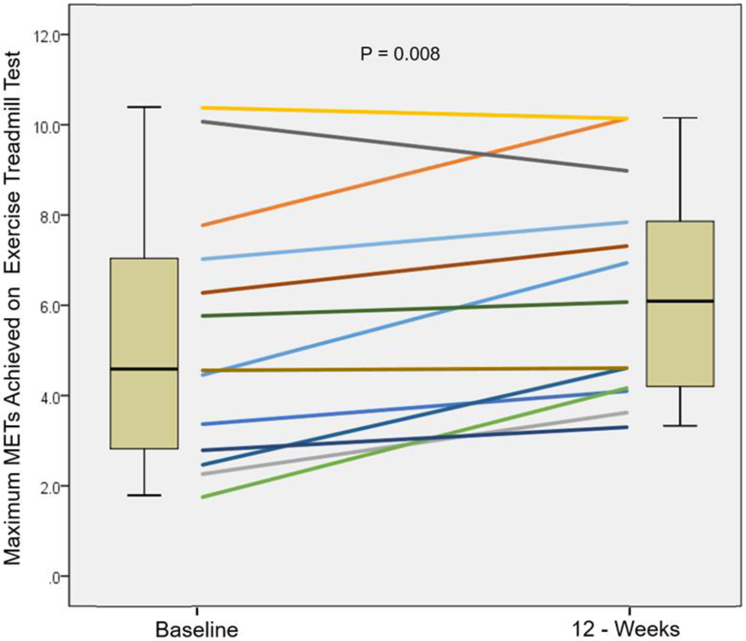
Figure 2.

Mean change in METS achieved during ETT, at baseline and at 12 weeks; (MD 1, 95% CI, 0.3 to 1.7; P=0.008). Box plots show data for the cohort as a whole (N=13). Line plots show changes for individual participants. METS = metabolic equivalents; ETT = exercise treadmill testing
