
Figure 3.
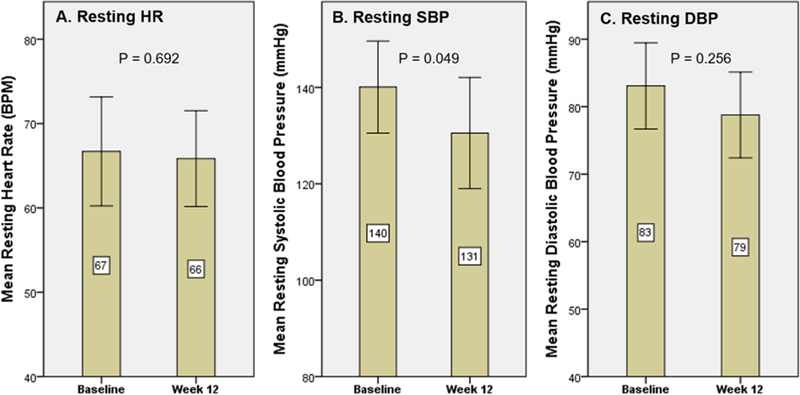
Changes in resting vital signs at baseline and at 12 weeks for those that completed the intervention (n=16) with (A) mean change in resting HR (0 BPM, 95% CI, −5.4 to 3.7); (B) mean change in resting SBP (MD 9.6, 95% CI −19.0 to −0.7; P=0.049); and (C) mean change in resting DBP (MD 4.3; 95% CI, −12.2 to 3.6; P=0.256). HR = heart rate; BPM = beats per minute; SBP = systolic blood pressure; DBP = diastolic blood pressure