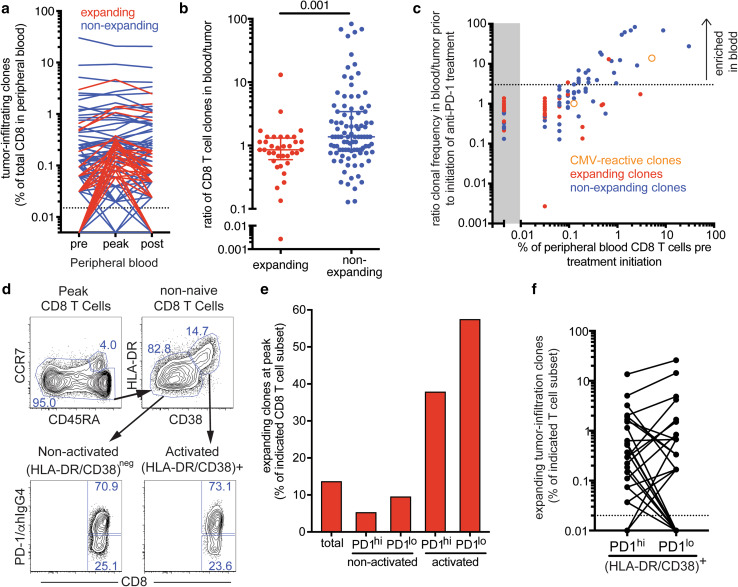
Fig. 4.
Expanding tumor-infiltrating clones are enriched in tumor and among activated peripheral blood CD8 T cells. a Frequency of tumor-infiltrating CD8 T cell clones in peripheral blood. Expanding clones (red) increased in frequency of at least 1.5-fold upon treatment initiation, whereas non-expanding clones (blue) showed less than 1.5-fold increase in frequency. Dotted line indicates limit of detection. b Ratio of expanding and non-expanding CD8 T cell clones in blood to tumor. p value was calculated using Mann–Whitney test. c Relationship of the ratio of clonal frequency in blood to tumor prior to treatment initiation and peripheral blood frequency of 131 tumor-infiltrating CD8 T cell clones. Expanding T cell clones are shown as red dots, non-expanding clones as blue dots, and previously identified CMV-reactive clones are depicted as orange open circles. Dotted line indicates a suggested blood/tumor ratio cut-off of 3 that would separate mainly non-expanding clones enriched in the peripheral blood. d Gates used for sorting of activated (HLA-DR/CD38) + and non-activated (HLA-DR/CD38)- CD8 T cells and subsequent separation based on PD-1 expression on day 21 post treatment initiation (post cycle 1). e Cumulative frequency of expanding tumor-infiltrating clones among the indicated CD8 T cell populations in the peripheral blood on day 21 post treatment initiation. f Frequency of expanding tumor-infiltrating clones in PD-1hi and PD-1lo-activated CD8 T cell subsets

