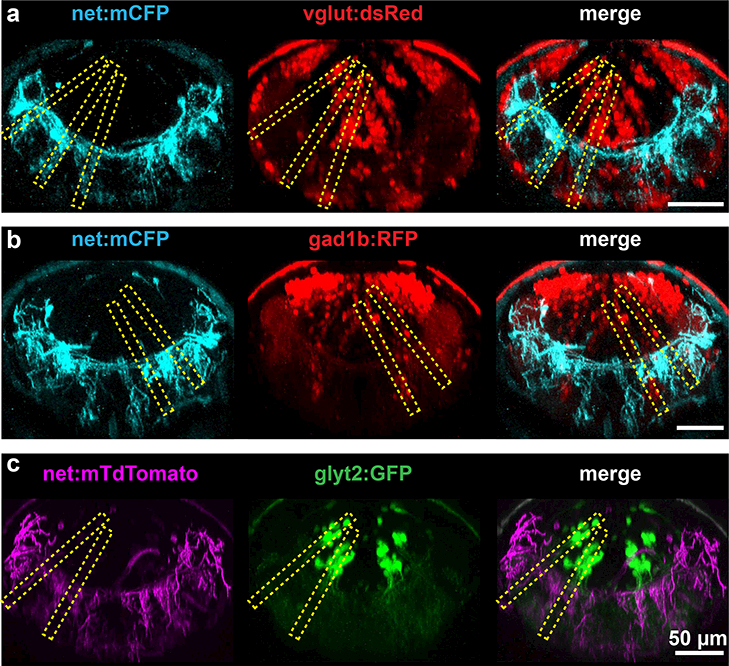
Figure 3: Comparison of various neurotransmitter stripes’ orientation with NA projections.

2 photon images of rhombomere 6 of 5 dpf larvae virtually resliced to show orientation of NA processes (first column) with glutamatergic (a), gad1b (b), and glycinergic (c) neurotransmitter stripes. Stripe orientation is indicated by yellow dashed boxes. Ventral-lying cell bodies are visible in vglut:dsRed and gad1b:RFP but not glyt2:GFP larvae.
