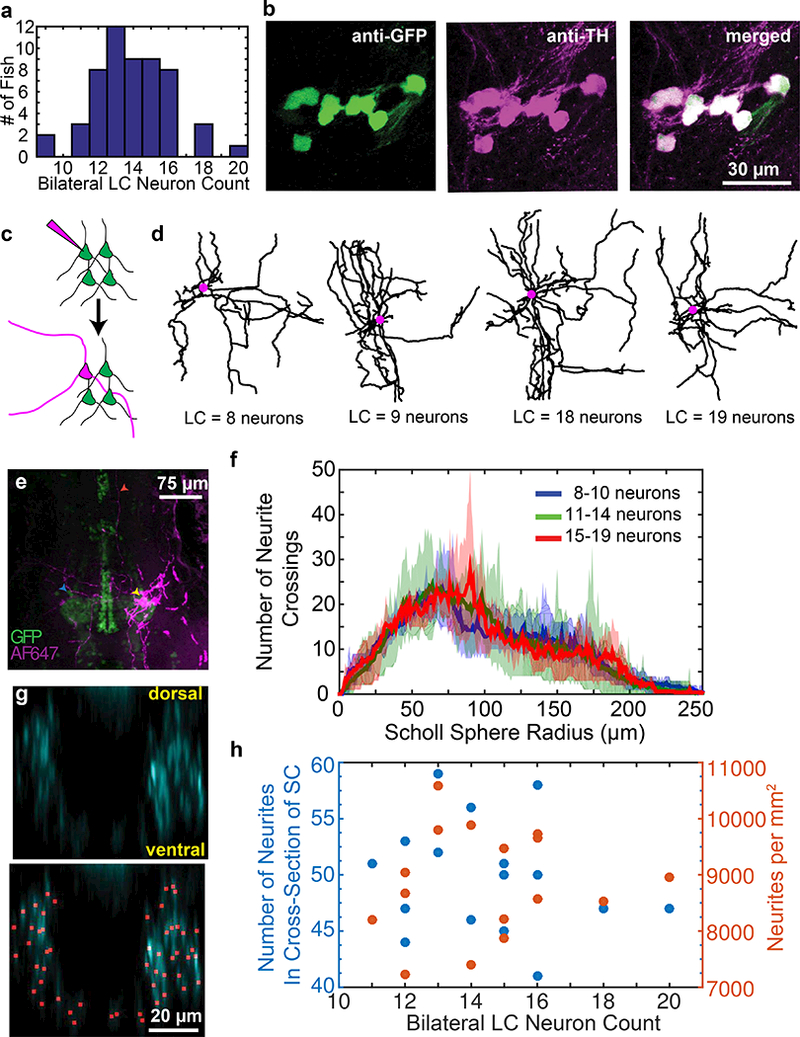
Figure 5: Projection density and LC neuron count.

Larvae at 5–7 dpf in multiple clutches of Tg(ETvmat2:gfp) showed a wide distribution in the number of bilateral LC neurons (a). Antibody staining with anti-TH and anti-GFP showed complete overlap of transgenic labeling within the LC (b). Single-cell electroporation (c) with Alexa Fluor 647 dextran enabled reconstruction of proximal LC neuron projections. Reconstructions (d) of the cell bodies (purple circles) and projections (black lines) were constructed for cells with varying numbers of neurons. Larger processes were visible for hundreds of microns from the soma (e, yellow arrow), with clear projections near the contralateral LC (blue arrow) and distal sites (red arrow). Projections were analyzed by Sholl analysis proximal to the soma. 2 photon images of the spinal cord sections were traced in 3D. Virtually reslicing the reconstruction allowed spinal projections to be viewed in cross section (g; top) and counted (g; bottom). The total number of projections was counted (h, blue data points) and used to compute an area density (h, orange data points) and plotted as a function of bilateral LC neuron count in 5–6 dpf larvae (n =16 fish).
