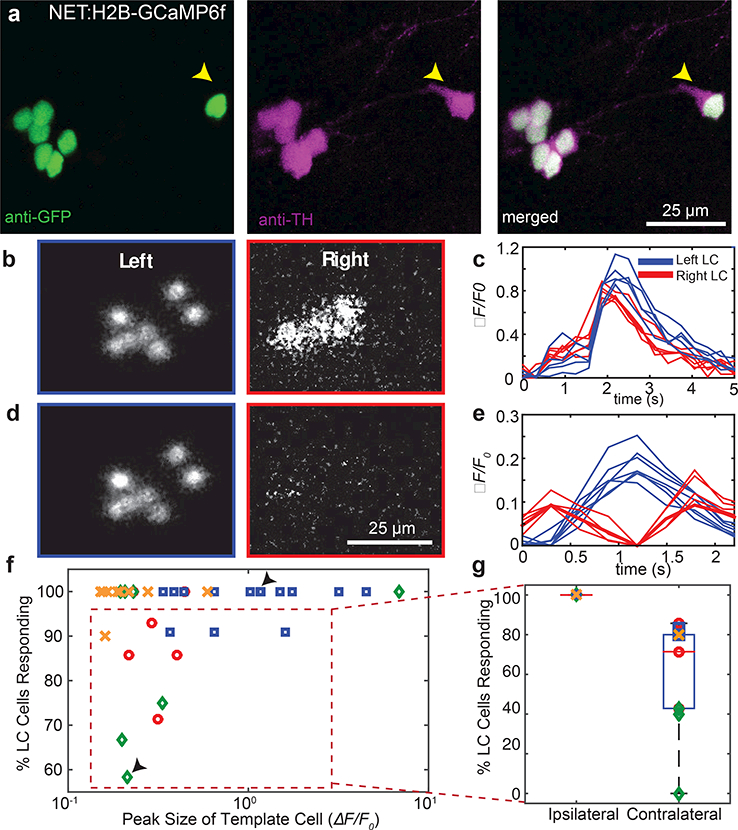
Figure 6: Bilateral LC neuron calcium imaging with light sheet microscopy.

Antibody labeling (a) showed complete overlap of reporter expression with TH expression in the Tg(net:H2B-GCaMP6f) transgenic line, including cells distal to the main cluster (yellow arrows). Simultaneous bilateral LC calcium imaging allowed us to calculate images (b,d) and traces (c,e) of fluorescence relative to baseline. Completely synchronous calcium events (b,c) were observed bilaterally, while asynchronous events were seen to vary across the body (d,e). Note the difference in the time axis between c and e. Events shown in (b) and (c) are from different animals; events in (d) and (e) correspond to the same event. The degree of synchrony versus event amplitude (f), where amplitude was defined as the largest peak amongst the traces from individual cells. Large-peak (c; f top arrow) and small-peak (e; f bottom arrow) calcium events showed differing degrees of synchrony. For events with less than 100% of the cells responding given our criteria (f; red dashed box), all of the non-responsive cells were contralateral to the cell with the largest peak (g).
