
Figure 5.
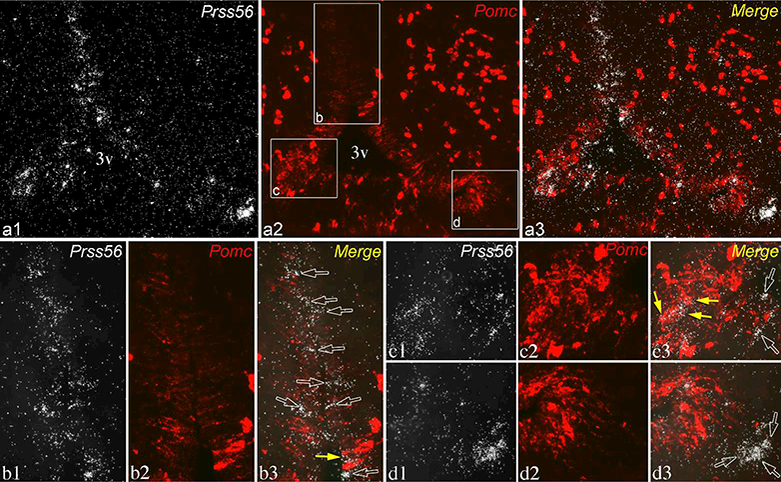
Dual-label ISH for Prss56 (silver grains, white) and Pomc (fluorescence, pseudocolored red) in a brain with intermediate expression levels in tanycytes for both transcripts. Section shown is close to level c2 in Fig. 2, from the same brain. (a1-a3) Lower magnification of the same field shows the distribution of Prss56 and Pomc in tanycytes. Higher magnification images of boxed areas in a2 are shown in lower panels, b-d. (b1-b3) In the α2 tanycyte domain, most Prss56-expressing tanycytes are negative for Pomc (open arrows), although 1 or 2 are labeled with Pomc hybridization signal (yellow arrow). (c1-c3) In the β1 domain, Prss56 hybridization signal concentrates over a few Pomc-expressing tanycytes (yellow arrows). (d1-d3) The group of γ tanycytes labeled for Prss56 is negative for Pomc (open arrows). 3v, third ventricle. Scale bar: 100μm on a; 25μm on bl (for b-e).