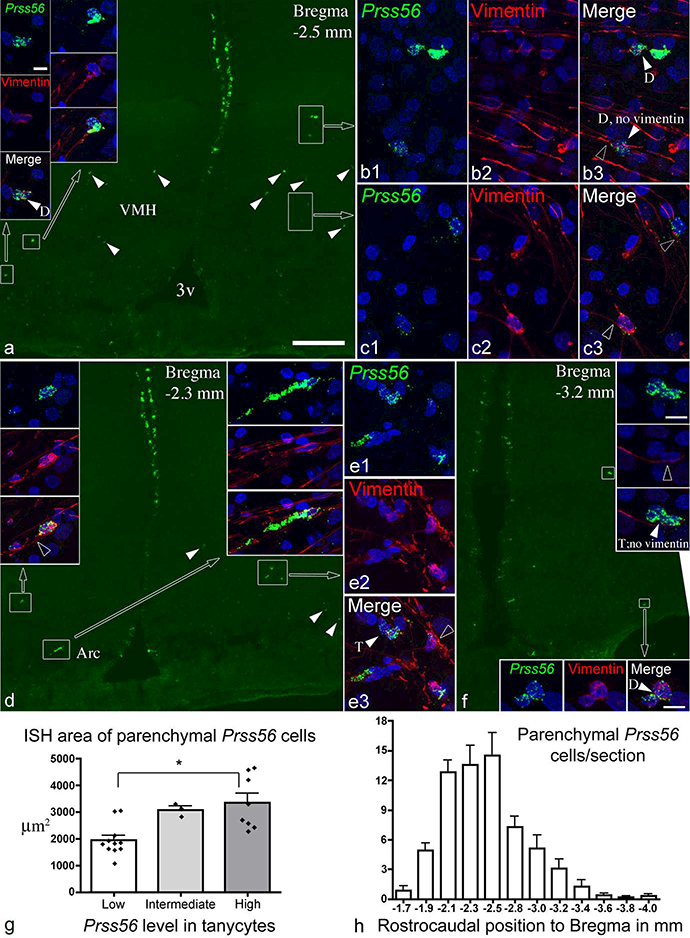
Figure 7.

(a, d, f) Distribution of Prss56-expressing parenchymal cells (arrowheads, boxed areas) in the ventromedial and arcuate nuclei. Sections are from male 15 week-old rats, one with high (a and d), another (f) with low Prss56 levels in tanycytes. Cells in boxed areas are shown in high magnification in insets, and in b, c and e. Vimentin immunofluorescence is shown in red, nuclear DAPI signal in blue. Most, though not all, Prss56 cells contain vimentin in their cytoplasm. In the high magnification images, white arrowheads indicate two (D) or three (T) closely adjacent Prss56 cells; open arrowheads point to tanycyte processes adjacent to Prss56 cells. (g) Quantification of FISH signal of parenchymal Prss56 cells (n=22 rats), and compared between groups with low, intermediate and high Prss56 in tanycytes; * p<0.01. (h) Rostrocaudal distribution of parenchymal Prss56 cells, showing mean cell number per section (n=10 rats). 3v, third ventricle; Arc, arcuate nucleus; VMH, ventromedial nucleus. Scale bars: 200 μm on a (for a, d, f); 10μm on top left inset (also for b, c, e and all insets except in f); 10μm on insets of f.
