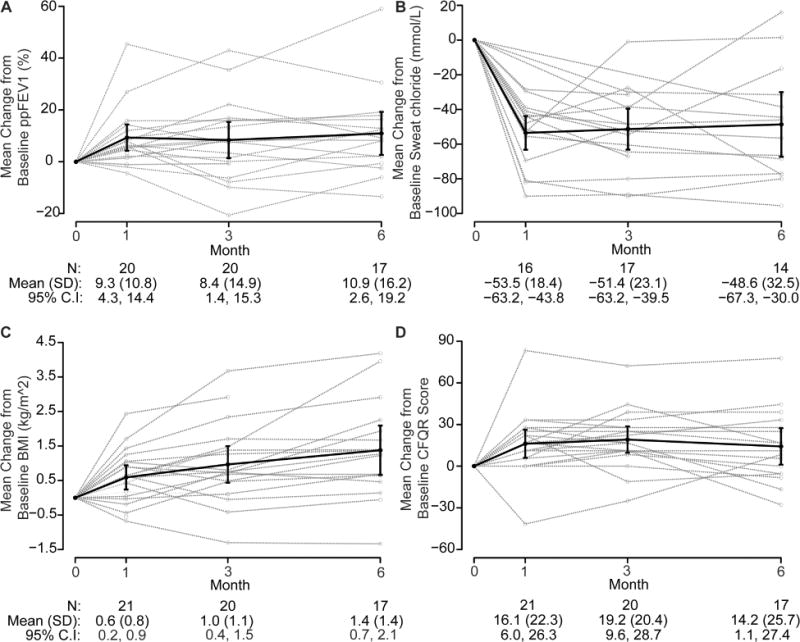
Figure 2. Mean change from baseline after 6 months of treatment.

(A) percent predicted FEV1; (B) BMI; (C) sweat chloride; and (D) CFQ-R respiratory score. ppFEV1 (percent predicted FEV1); BMI (body mass index); CFQ-R (Cystic Fibrosis Questionnaire-Revised)
