
Figure 4.
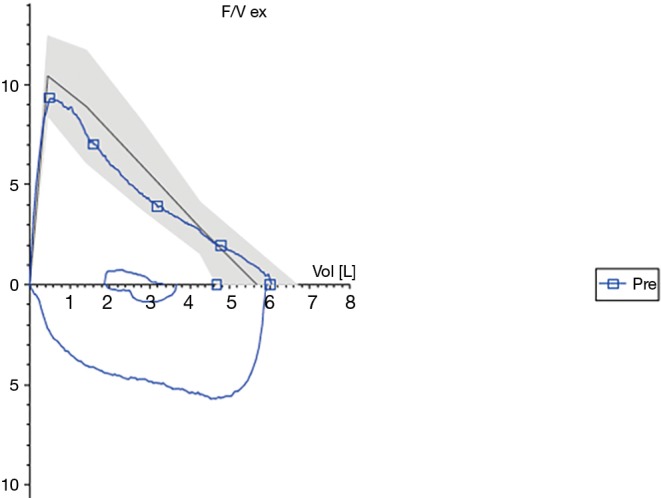
Flow-volume curve at 9 months of follow-up. Black line: normal curve; blue line: curve of patient’s flow volume; X-axis: volume (L), Y-axis: flow (L/s).
Official websites use .gov
A
.gov website belongs to an official
government organization in the United States.
Secure .gov websites use HTTPS
A lock (
) or https:// means you've safely
connected to the .gov website. Share sensitive
information only on official, secure websites.
Flow-volume curve at 9 months of follow-up. Black line: normal curve; blue line: curve of patient’s flow volume; X-axis: volume (L), Y-axis: flow (L/s).