
Figure 5.
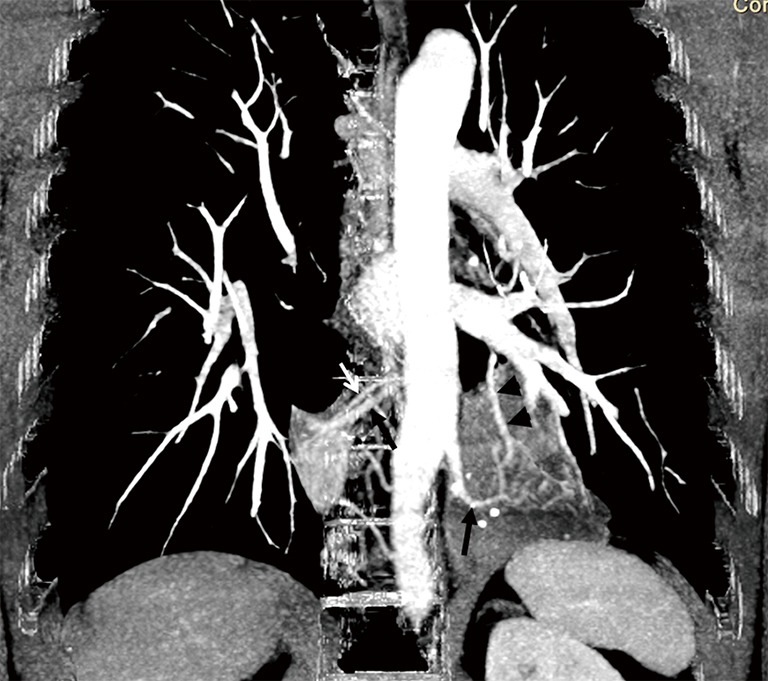
Coronal section of maximum intensity projection CT image showing aberrant arterial supply from the lower thoracic aorta (black arrows) to both sequestrated lungs with draining veins to the azygos vein on the right (white arrow) and pulmonary vein on the left (black arrowhead).