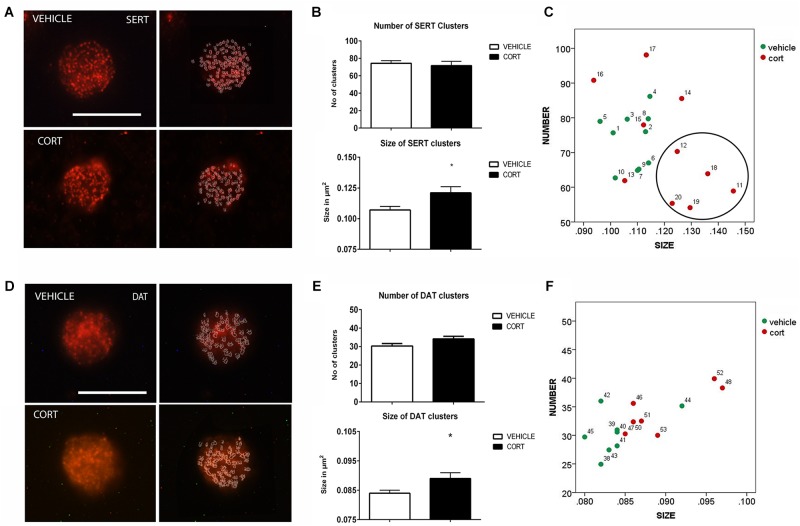
FIGURE 2.
Analysis of SERT and DAT MPC in lymphocytes. SERT immunolabeling is observed as patches of immunostaining in the plasma membrane of lymphocytes that are amenable to quantification by image analysis. Panel (A) shows SERT immunostaining in a representative lymphocyte from vehicle or CORT treated rats, and how these clusters are evaluated by using image-J. Calibration bar: 10 μm. Panel (B) shows that repeated CORT increases SERT clusters size but does not change the number of clusters per lymphocyte. Panel (C) left portraits the representation of the average number and size of SERT clusters in individual animals (identified by numbers). Note that a subset of CORT treated animals is identified by having a low number and high size of SERT clusters (circle). DAT immunolabeling is observed as patches of immunostaining in the plasma membrane of lymphocytes that are amenable to quantification by image analysis (Panel D Calibration bar: 10 μm). Panel (E) shows that repeated CORT increases DAT clusters size but does not change the number of clusters per lymphocyte. Panel (F) portraits a scatter plot of how CORT alters DAT MPC parameters. Significant differences, p value < 0.05, are indicated by an asterisk (∗).

