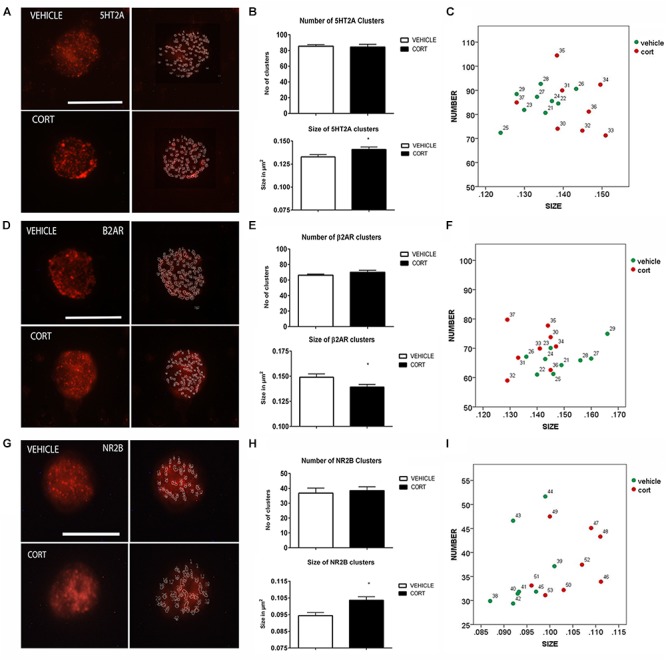
FIGURE 3.

Analysis of 5HT2A, β2AR, and NR2B receptors MPC in lymphocytes. 5HT2A immunolabeling is observed as patches of immunostaining in the plasma membrane of lymphocytes that are amenable to quantification by image analysis (Panel A Calibration bar: 10 μm). Panel (B) shows that repeated CORT increases 5HT2A clusters size but does not change the number of clusters per lymphocyte, while Panel (C) left portraits the alterations induced by CORT in number Vs size of 5HT2A clusters. Panel (D) illustrates the identification of β2AR clusters in peripheral lymphocytes (Calibration bar: 10 μm). Panel (E) shows the effect of repeated CORT in decreasing the size of β2AR clusters without altering their number. Panel (F) portraits the representation of the average number and size of 5HT2A clusters in individual animals (identified by numbers). Note that while for most protein clusters CORT induces an increase in clusters size in the case of β2AR the size of the clusters is decreased. Panel (G) presents representative micrographs of NR2B labeling in lymphocytes from vehicle or CORT-treated animals (Calibration bar: 10 μm). Panel (H) shows the effect of repeated CORT in increasing the size of NR2B clusters without altering their number. Panel (I) portraits the representation of the average number and size of NR2B clusters in individual animals. Significant differences, p value < 0.05, are indicated by an asterisk (∗).
