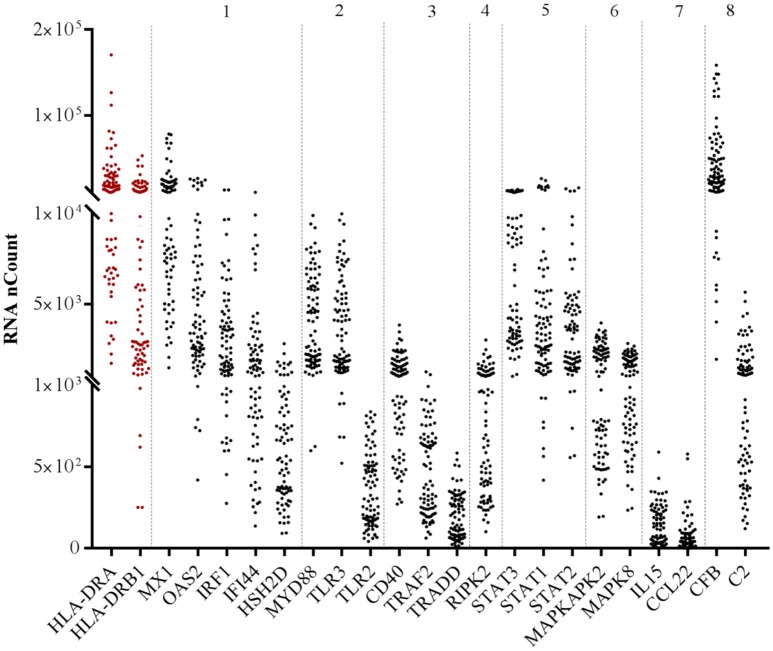
Figure 1.
RNA abundance of the selected highly correlated genes with both HLA-DR transcripts according to their family. RNA abundance is represented by the detected RNA copies on the y-axis. Numbers above the hatched rectangle correspond to each target family selected: (1) IFN and ISGs, (2) TNF superfamily, (3) TLR and related factors, (4) chemokines/cytokines, (5) complement and CRP (6) RIPK enzymes, (7) STAT, (8) MAPK.

