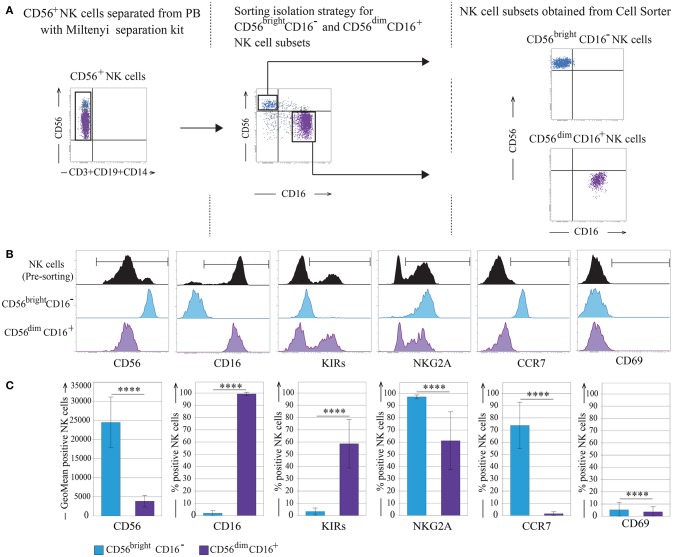
Figure 1.
CD56bright and CD56dim NK cell subsets isolation strategy. (A) Sorting separation strategy for CD56bright/CD16− and CD56dim/CD16+ NK cells subsets. (B) Informative NK cell surface markers pre- and post-sorting are shown (one representative donor). (C) Post-sorting statistical analysis of informative NK cells surface markers. Data represents the mean ± SD, n = 10 donors. T-test analysis comparing CD56bright/CD16− and CD56dim/CD16+ NK cell subsets indicated as ****p < 0.0001. Color legend: Pre-sorting NK cells are indicated in black, CD56bright/CD16− NK cells are indicated in light blue and CD56dim/CD16+ NK cells are indicated in purple.

