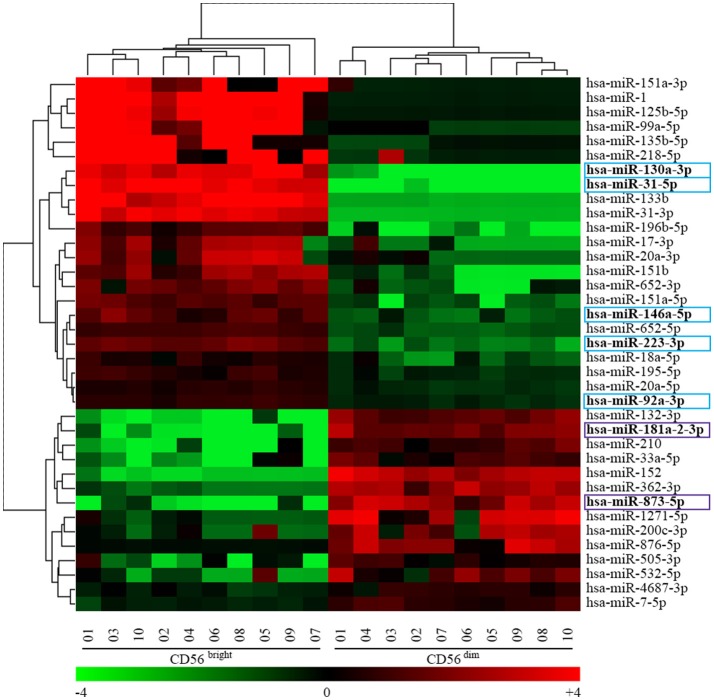
Figure 2.
Heatmap representing the unsupervised hierarchical clustering analysis of CD56bright/CD16− and CD56dim/CD16+ NK cells miRNAs signature obtained with the univariate analysis. Heatmap of 37 miRNAs signature identified by the human miRNA microarray kit v19.0. Dendrograms indicate the results of the bi-clustering analysis. Table at the bottom of the figure helps with the translation between centered log2 data and fold-change values, and also introduces the heat map color scheme used. Colored boxes indicate 7 of the most regulated miRNAs. Color legend: the most up-regulated miRNAs on CD56bright/CD16− NK cells are indicated in light blue and the most up-regulated miRNAs on CD56dim/CD16+ NK cells are indicated in purple.

