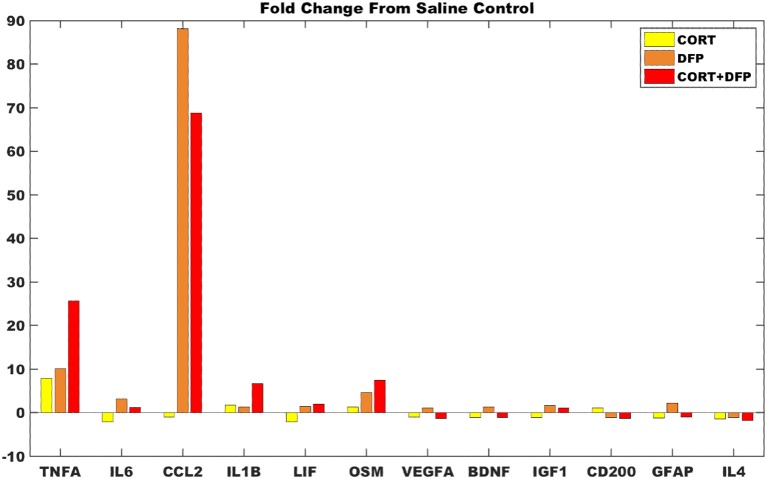
Figure 4.
Gene expression changes in mouse cortex for exposure conditions compared to control. Fold change in marker gene expression levels from RNAseq of samples collected at 6 h relative to resting saline control for data obtained in cortex for the subset of 12 markers represented in the logic circuit model.

