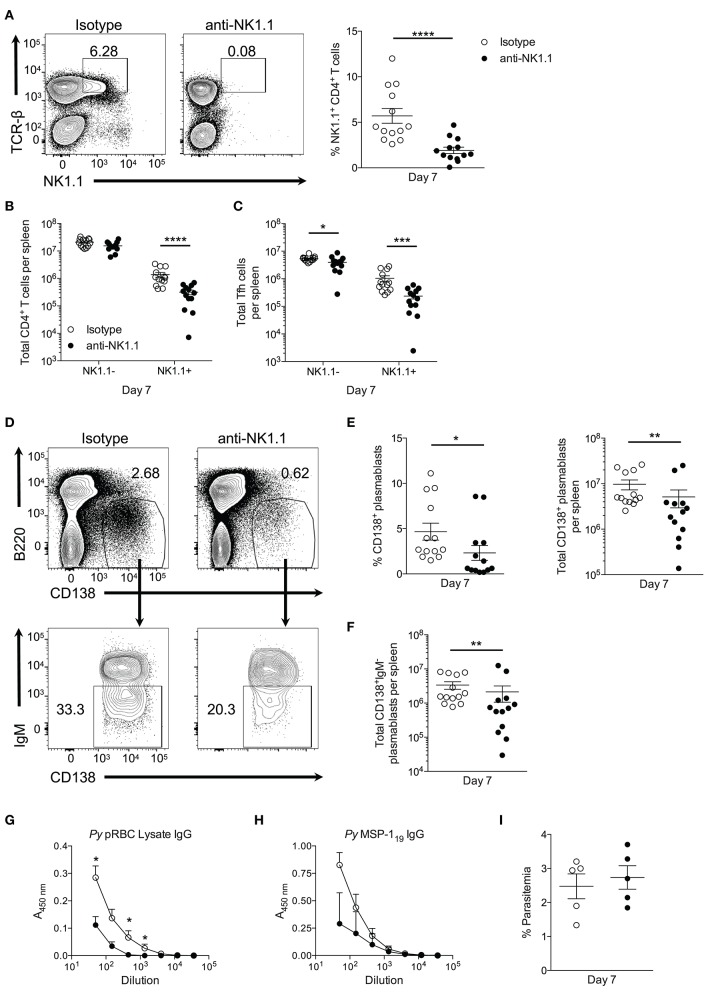
Figure 7.
Depletion of NK1.1+CD4+ T cells inhibits parasite-specific Ab production. (A) The frequency of NK1.1 staining of live TCR-βhiNK1.1+ CD4+ T cells in isotype control or anti-NK1.1 Ab-treated mice at day 7 post-infection. (B) Total number of live splenic NK1.1 positive or negative CD4+TCRβhi T cells in isotype control or anti-NK1.treated mice at day 7 post-infection. (C) Total number of live splenic NK1.1 positive or negative Tfh-like (CXCR5+PD-1+) cells in isotype control or anti-NK1.1 Ab-treated mice. (D) Representative B220 and CD138 expression in isotype control or anti-NK1.1 Ab-treated mice at day 7 post-infection (above). Typical IgM staining of the gated area in (D) (below). (E) Frequency and the total number of live B220lowCD138+ plasmablasts or (F) IgM− class-switched plasmablasts in isotype control or anti-NK1.1 Ab-treated mice. (A–C,E,F) Significance determined via an unpaired nonparametric Mann-Whitney test. *p < 0.05, **p < 0.01, ***p < 0.001, ****p < 0.0001. (G) Relative pRBC-lysate specific or (H) MSP-119-specific IgG Ab titer at day 7 post-infection in isotype control or anti-NK1.1 Ab-treated mice. Significance determined by two-way ANOVA post hoc Bonferroni's multiple comparisons test. **p < 0.01, ****p < 0.0001. (I) Peripheral blood parasite load in isotype control or anti-NK1.1 Ab-treated mice. Data are representative of three combined experiments (A–F) or three independent experiments (G–I) (error bars, s.e.m.).

