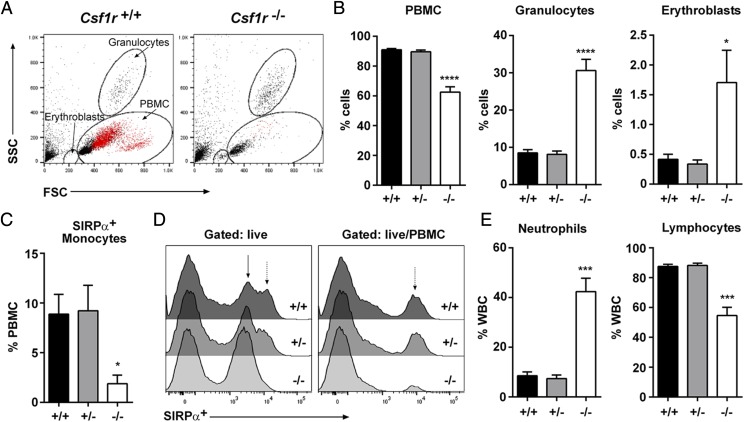
FIGURE 3.
Analysis of whole blood. (A) Whole EDTA blood from adult rats was used to analyze forward versus side scatter (FSC/SSC) profiles by flow cytometry. SIRPα+ monocytes are colored red. (B) The percentages of PBMCs, granulocytes, and erythroblasts were determined by FSC/SSC profiles (n = 5 per genotype). (C) Cells were gated on SIRPα+ PBMC to determine the percentage of monocytes (n = 5 per genotype). (D) SIRPα expression was analyzed in whole EDTA blood gating on total live cells and live PBMC. Solid arrow highlights SIRPαlow granulocytes. Dotted arrow highlights SIRPαhigh monocytes (n = 5 per genotype). (E) Whole EDTA blood was analyzed on an automated counter to determine the percentage of neutrophils and lymphocytes in WBCs (n = 6+/+, 10+/−, and 8−/−). Graphs show the mean + SEM. Significance compared with wild type is indicated by *p = 0.046 (erythroblasts) and 0.015 (monocytes), ***p < 0.0003, and ****p < 0.0001 using a t test.

