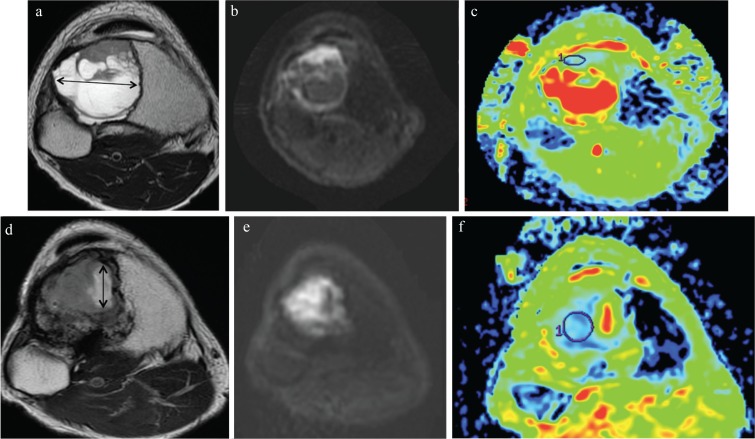
Fig. 1.
Magnetic resonance images of tissues obtained from a 37 y/o male with giant cell tumors of the bone (GCTB) in the tibia. Images are shown before and after denosumab administration. (a) T2-weighted image of a MRI showing GCTB exhibiting a cystic component in the proximal tibia. The tumor was 60 mm in size, including the cystic component. The cystic component was 43 mm in diameter. (b and c) On diffusion weighted image, the solid part of the tumor showed high intensity. On apparent diffusion coefficient (ADC) map (b = 1,000), the ADC value of the solid part of the tumor was 1.03 (×10−3 mm2/s). (d) T2-weighted image after denosumab treatment showing that the tumor had decreased in size to 50 mm. The size of cystic component was 18 mm (double-headed arrow). (e and f) On diffusion weighted image, the solid part of the tumor showed high intensity. On ADC map (b = 1,000), the ADC value of the solid part of the tumor decreased to 0.66 (×10−3 mm2/s).

