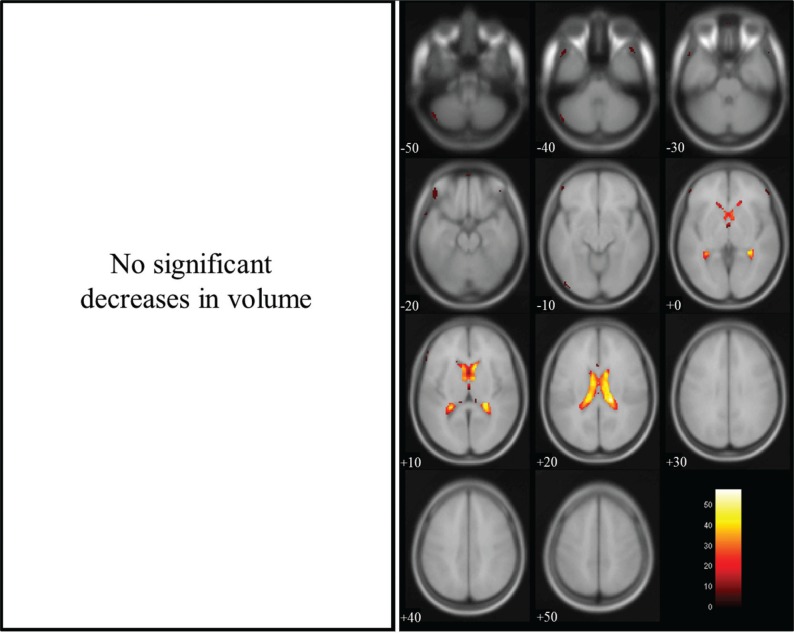
Fig. 4.
Cerebrospinal fluid (CSF) volume in dilated 3D-T1-weighted magnetic resonance images (T1WI) compared with that in non-dilated 3D-T1WI. Regions of significantly increased volume (max cluster size is 6934 and max T value is 57.70 as true volume change within the lateral ventricles; and max cluster size is 357 and max T value is 15.43 as the estimation error for the brain surface) are superimposed on the T1 template image; no region showed a significant decrease in volume. The color bar (red to white) represents the T score. R and L indicate the right and left sides of the subject, respectively. (The color version is available online.)

