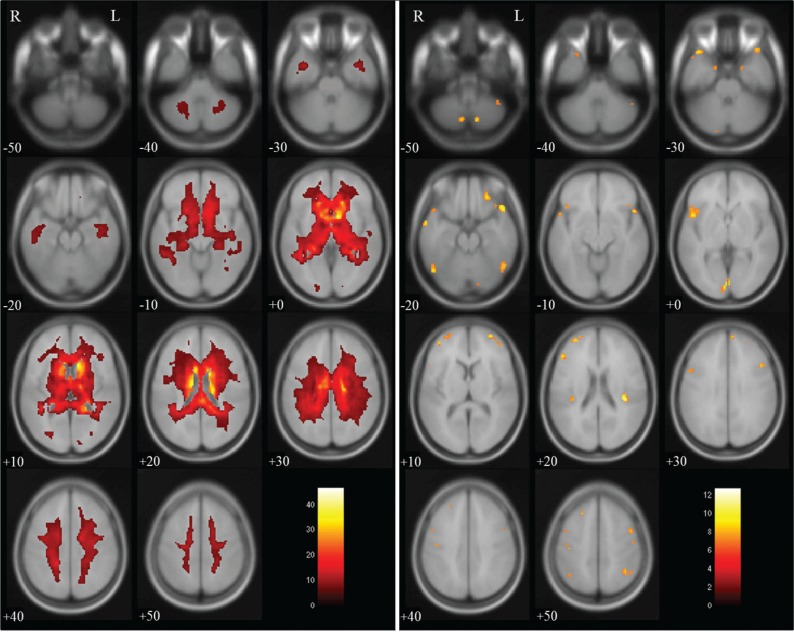
Fig. 5.
Brain volume in dilated 3D-T1-weighted magnetic resonance images (T1WI) compared with that in non-dilated 3D-T1WI. Regions of significantly decreased volume (max cluster size is 103039 and max T value is 46.62 as true volume change within the lateral ventricles) are shown in the left panel, and regions of significantly increased volume (max cluster size is 530, max T value is 12.69 as the estimation error for the brain surface) are shown in the right panel. Significant volume differences are superimposed on the T1 template image. The color bar (red to white) represents the T score. R and L indicate the right and left sides of the subjects, respectively. (The color version is available online.)

