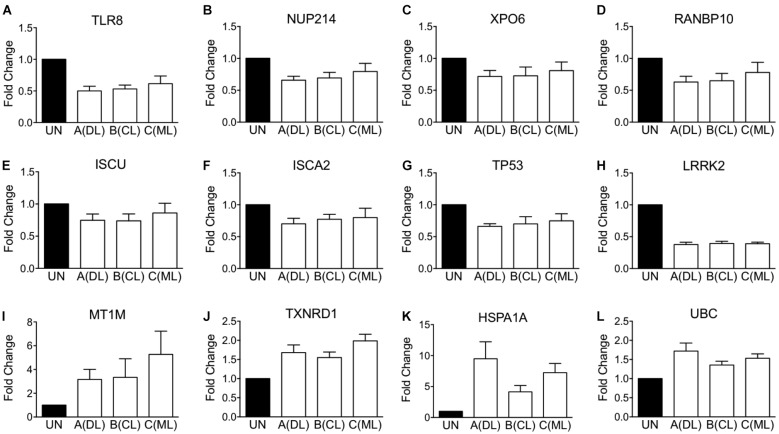
FIGURE 3.
qPCR validation of changes in gene expression observed on microarrays. Validation performed using RNA samples of additional blood donors different than those included in microarray analysis shown in Figure 2. (A–H) Shows RT-qPCR of selected MDM transcripts whose expression was down-regulated, according to Affymetrix microarrays. (I–L) Shows RT-qPCR of selected MDM transcripts whose expression was up-regulated. Data consist in the average fold change elicited by each L. braziliensis clade representative relative to uninfected MDMs from the same donor.

