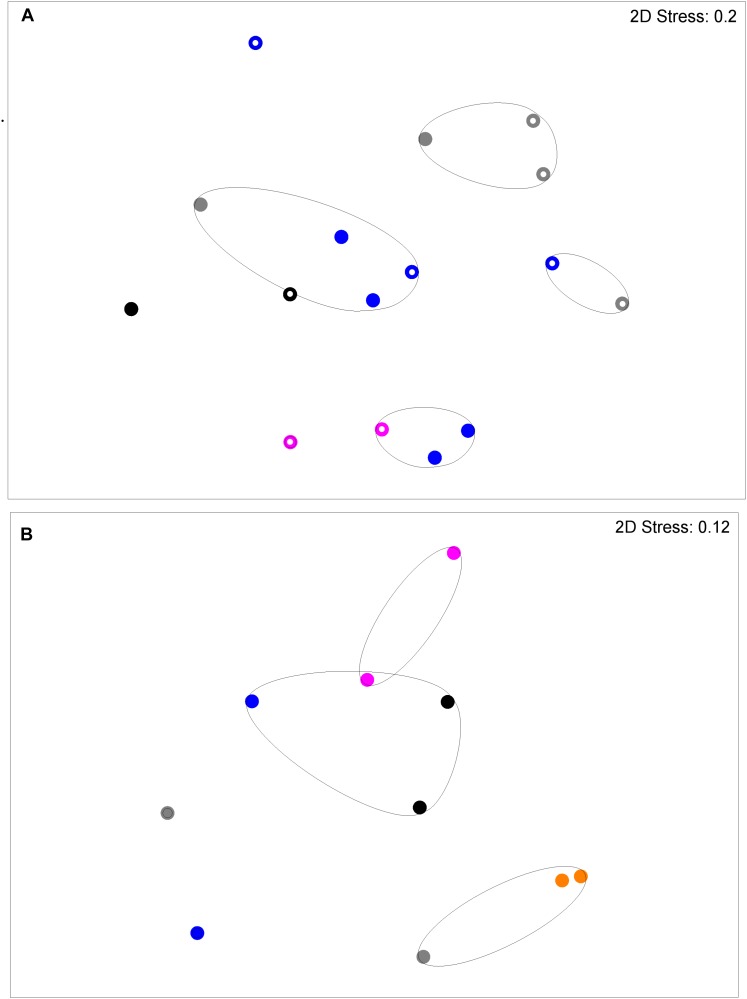
FIGURE 5.
DNA profiles derived from plaque (A) and saliva (B) from S-ECC children and their siblings (see legend to Figure 2). Plaque profiles could be differentiated on the basis of family with (p = 0.031). S-ECC and cavity-free families could not be differentiated (p = 4.18). Carious sites and cavity-free sites could not be differentiated (p = 8.39). Salivary profiles could be differentiated on the basis of family (p = 0.02).

