
Fig. 5.
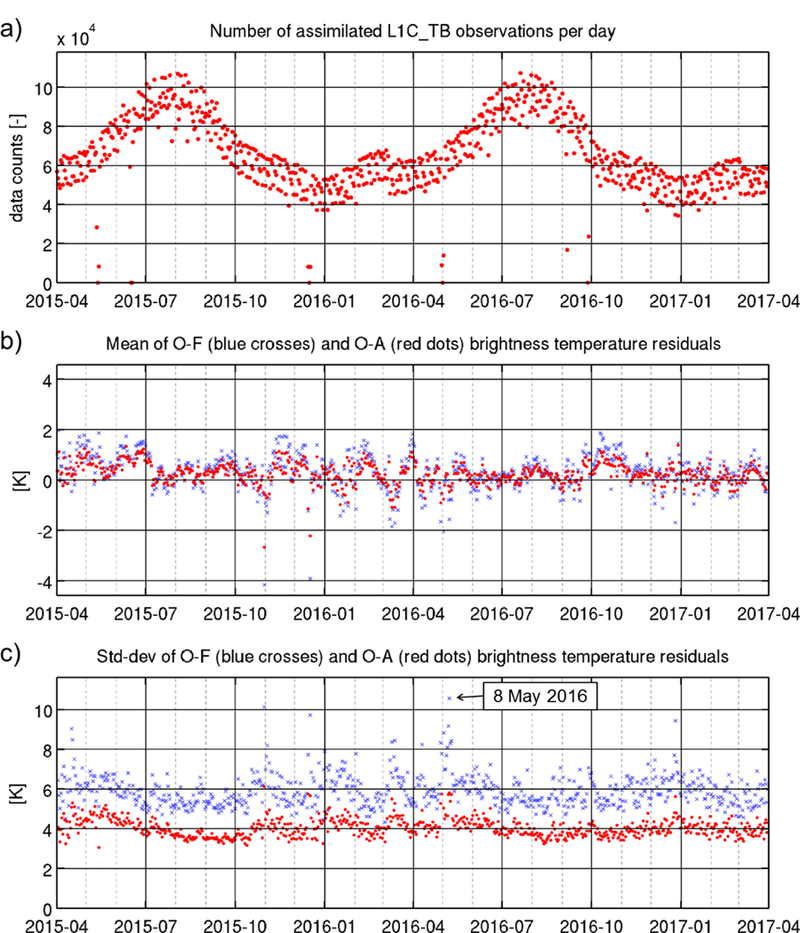
(a) Daily counts of SMAP Tb observations assimilated into L4_SM during April 2015 to March 2017, including H-pol and V-pol data from ascending and descending orbits. (b) Mean of the corresponding O-F and O-A Tb residuals, where the mean values are computed separately for each 3-hourly analysis by averaging across the global land domain (where SMAP observations are assimilated) and then averaging the resulting values over the 8 analysis times for each day. (c) As in (b) but for the standard deviation. Vertical grid lines indicate the first day of each month.