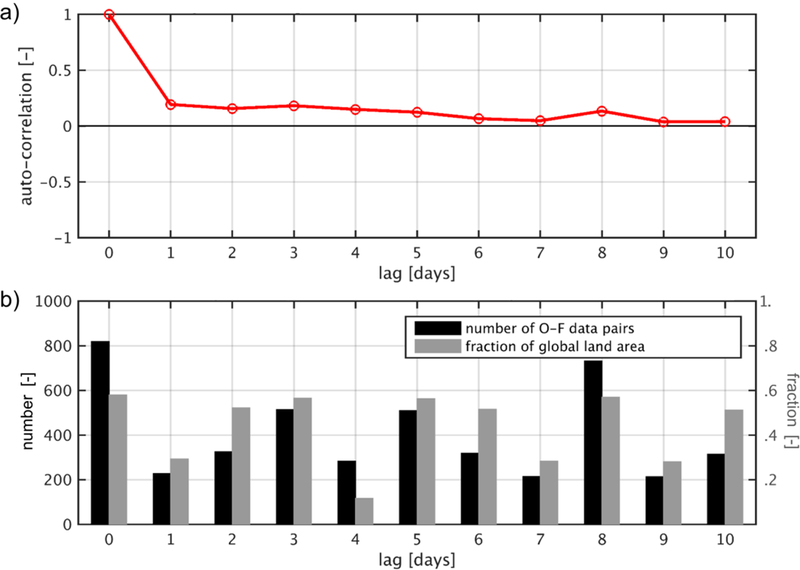
Fig. 8.

(a) Spatially averaged, lagged sample auto-correlation of the O-F Tb residuals. (b) Average number of O-F data pairs at each grid cell (black; left axis) and fractional area coverage (gray; right axis) contributing to the sample auto-correlation values.
