
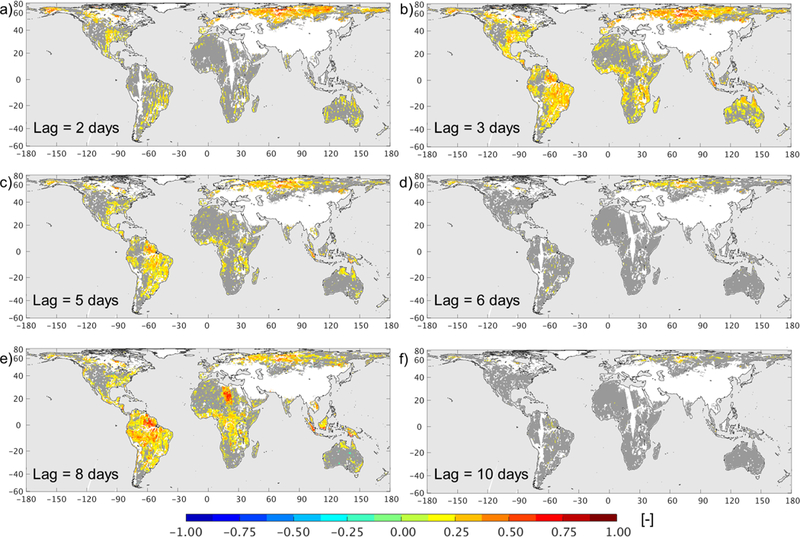
Fig. 9.
Sample auto-correlation of the O-F Tb residuals at (a) 2-day, (b) 3-day, (c) 5-day, (d) 6-day, (e) 8-day, and (f) 10-day lag. Values that are not significantly different from zero (at the 5% level) are shown in gray.
Official websites use .gov
A
.gov website belongs to an official
government organization in the United States.
Secure .gov websites use HTTPS
A lock (
) or https:// means you've safely
connected to the .gov website. Share sensitive
information only on official, secure websites.
Sample auto-correlation of the O-F Tb residuals at (a) 2-day, (b) 3-day, (c) 5-day, (d) 6-day, (e) 8-day, and (f) 10-day lag. Values that are not significantly different from zero (at the 5% level) are shown in gray.